Categories: Technical analysis

EURGBP Wave Analysis – 28 August, 2019

  • EURGBP reversed from support area
  • Further gains are likely

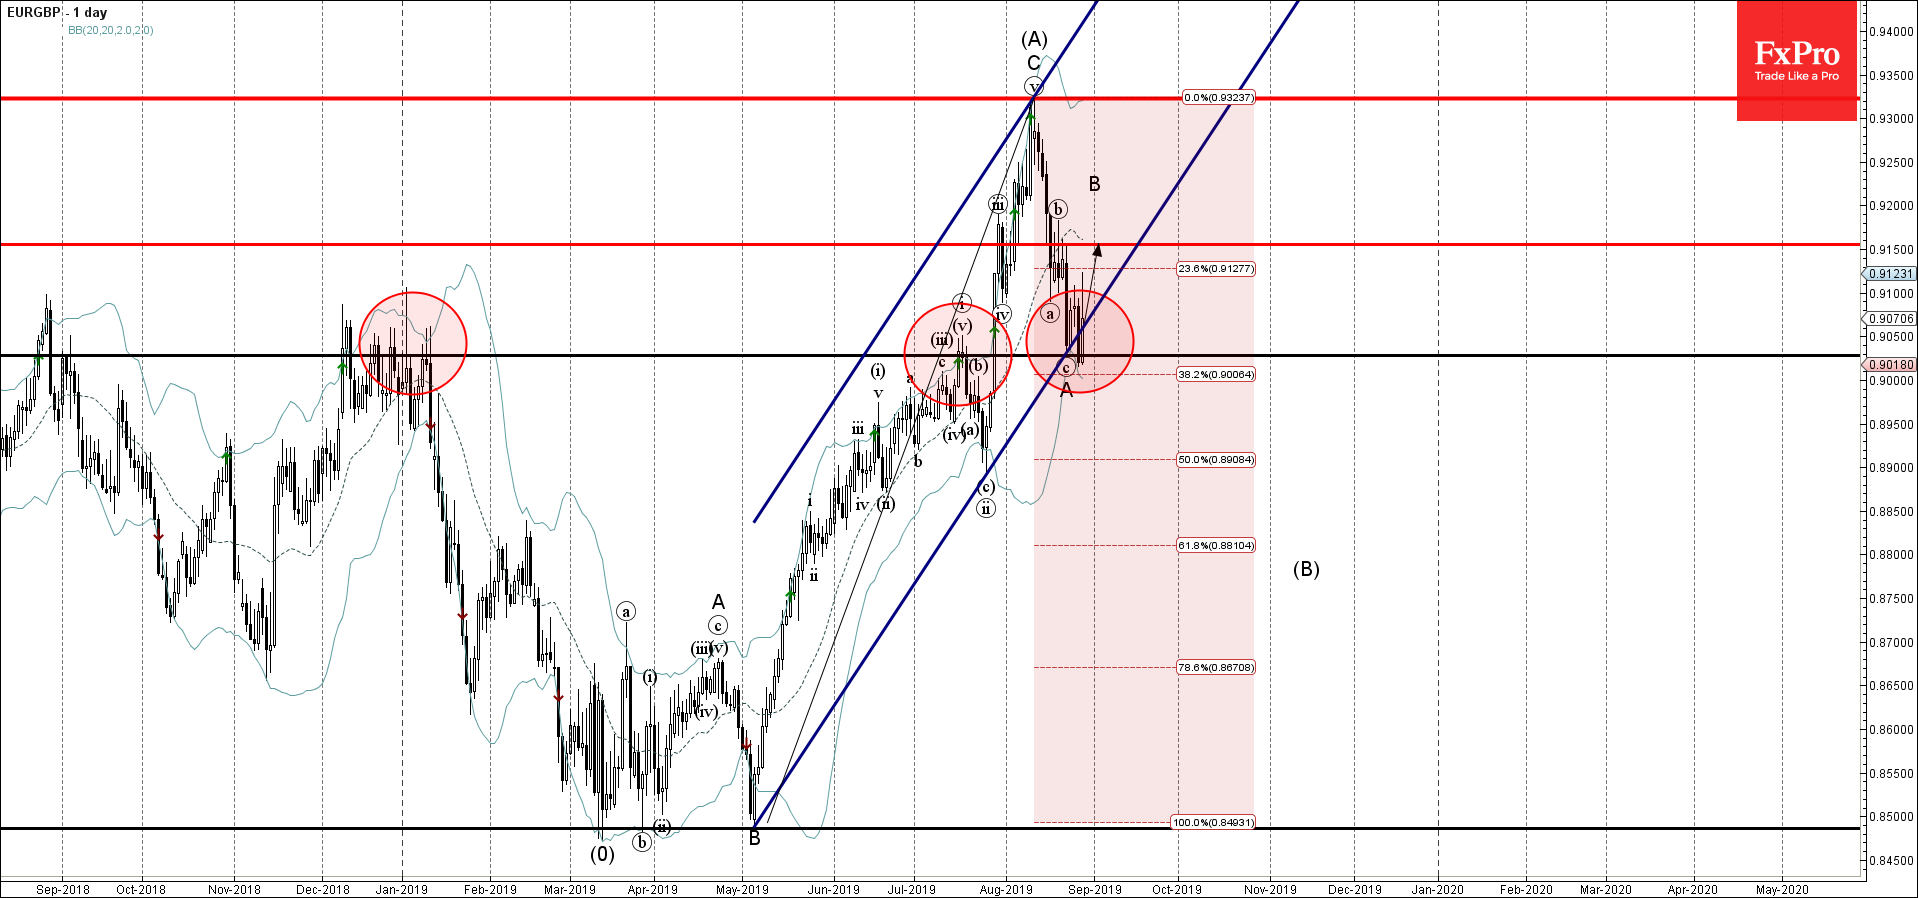
EURGBP recently reversed up from the support area lying between the support level 0.9030 (former resistance from July and January), support trendline of the daily up channel from May and the lower daily Bollinger Band.

The upward reversal from this support area started the active short-term corrective wave B.

EURGBP is expected to rise further and retest the next resistance level 0.9150 (top of the previous short-term wave (b) from last week).

The FxPro Tech Analysis Team

The FxPro technical experts prepare a daily analysis of the most active currency pairs (majors, crosses, exotics) and commodities. Selected instruments are reviewed on daily trends (D1, H4), using the active Elliott Wave setups, Japanese candlesticks, indicators, and support/resistance levels.

Share
Published by
The FxPro Tech Analysis Team

Recent Posts

Silver and gold recovered quickly. What’s next? 

Gold and silver have been enjoying a return to demand since early May, and buyers…

3 days ago

Toncoin catches up with XRP

Market picture  The crypto market added 2.8% in the last 24 hours to a total…

3 days ago

Adobe Wave Analysis 9 May 2024

- Adobe reversed from resistance level 500.00 - Likely to fall to support level 460.00…

3 days ago

Goldman Sachs Wave Analysis 9 May 2024

- Goldman Sachs rising inside impulse waves 3 and (3) - Likely to rise to…

3 days ago

WTI crude oil Wave Analysis 8 May 2024

- WTI crude oil reversed from support area - Likely to rise to resistance level…

4 days ago

AUDJPY Wave Analysis 8 May 2024

- AUDJPY reversed from support area - Likely to rise to resistance level 103.00 AUDJPY…

4 days ago

This website uses cookies