Categories: Technical analysis

EURGBP Wave Analysis – 27 March, 2020

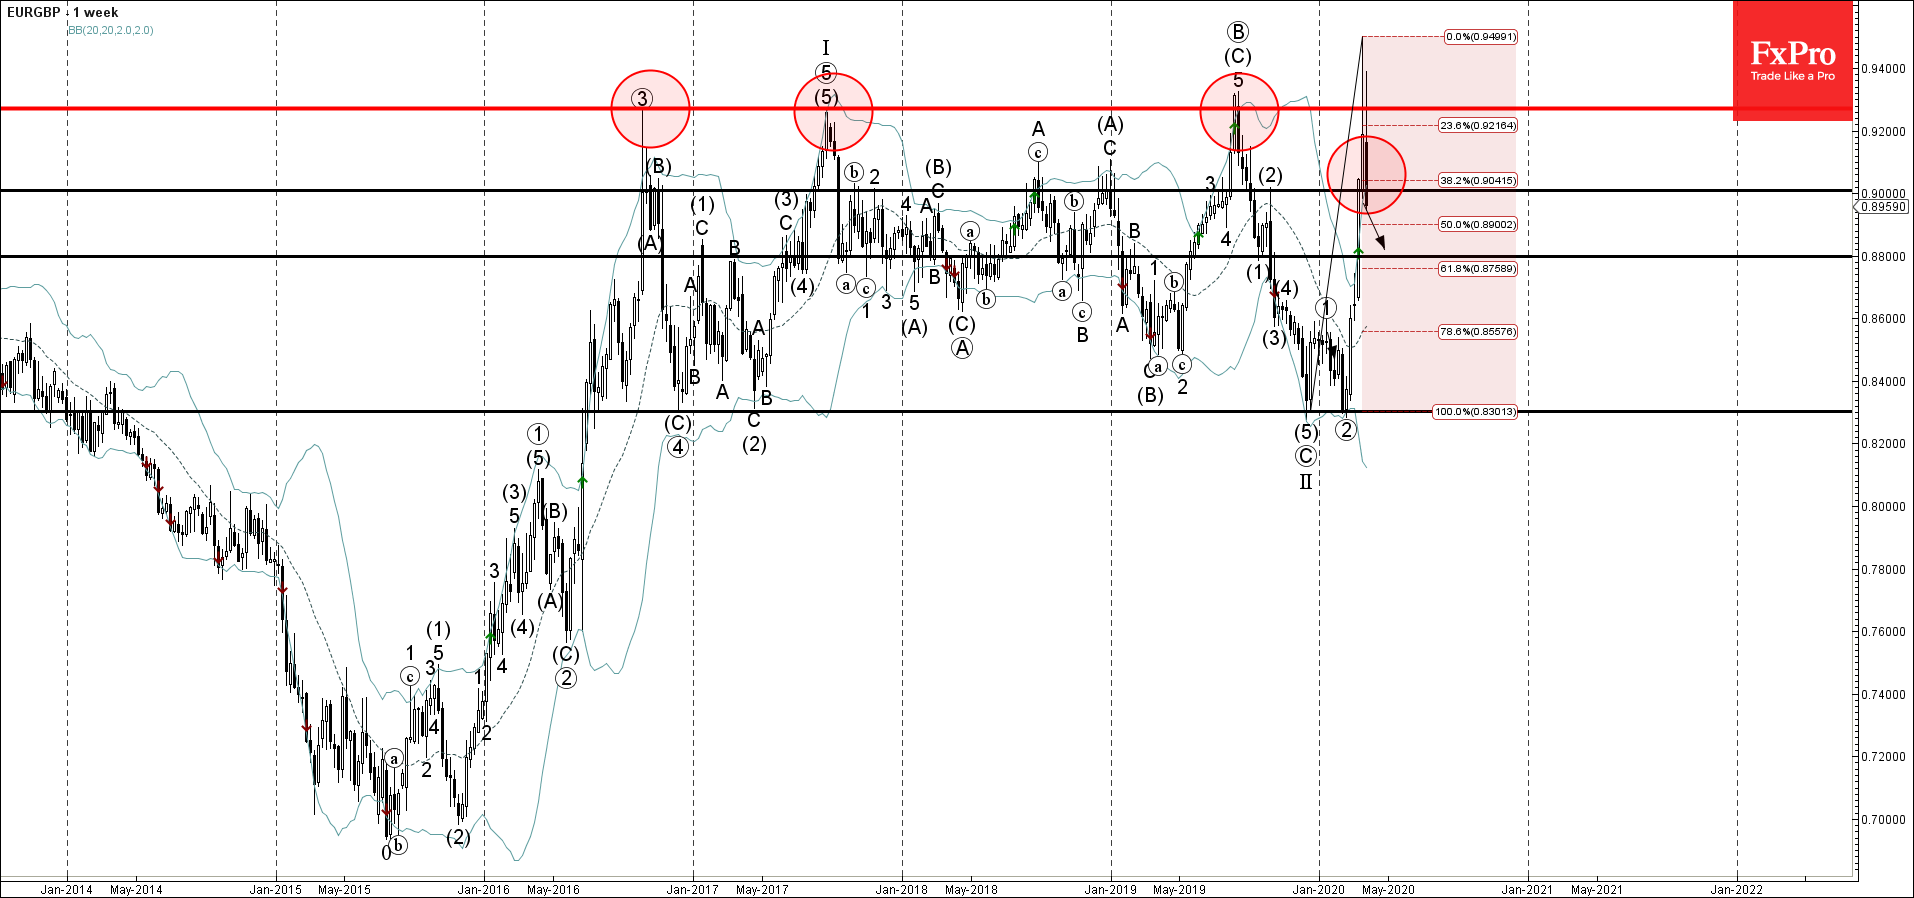
  • EURGBP broke round support level 0.9000
  • Likely to fall to 0.8800

EURGBP under bearish pressure following the earlier breakout of the key round support level 0.9000 (former strong resistance from last year).

The breakout of the support level 0.9000 coincided with the breakout of the 38.2% Fibonacci retracement level of the previous sharp upward impulse from December.

EURGBP is likely to fall further toward the next support level 0.8800 (standing close to the 61.8% Fibonacci retracement level of the previous upward impulse from May).

The FxPro Tech Analysis Team

The FxPro technical experts prepare a daily analysis of the most active currency pairs (majors, crosses, exotics) and commodities. Selected instruments are reviewed on daily trends (D1, H4), using the active Elliott Wave setups, Japanese candlesticks, indicators, and support/resistance levels.

Share
Published by
The FxPro Tech Analysis Team
Tags: EURGBP

Recent Posts

Markets pick up signals from the White House

Donald Trump has no intention of dismissing Jerome Powell. The White House's decision to postpone…

1 hour ago

Nat Gas Current situation #tradelikeapro #tradingshort #tradingtips #gas #tradingstrategy #trading

Today is Thursday, January 15th. Once again we will talk about the gas market. The…

2 hours ago

Bitcoin aims to break out of a corrective rebound

Crypto market rebounds, Bitcoin eyes $100K, Dash surges, institutional demand rises, and Ethereum staking hits…

2 hours ago

Bitcoin Wave Analysis – 14 January 2026

Bitcoin: ⬆️ Buy - Bitcoin broke resistance area - Likely to rise to resistance level…

16 hours ago

NZDJPY Wave Analysis – 14 January 2026

NZDJPY: ⬇️ Sell - NZDJPY reversed down from the resistance area - Likely to fall…

16 hours ago

What is Leverage?

Leverage is a mechanism that lets traders control larger positions using smaller capital. By choosing…

21 hours ago

This website uses cookies