Categories: Technical analysis

EURGBP Wave Analysis 25 March, 2021

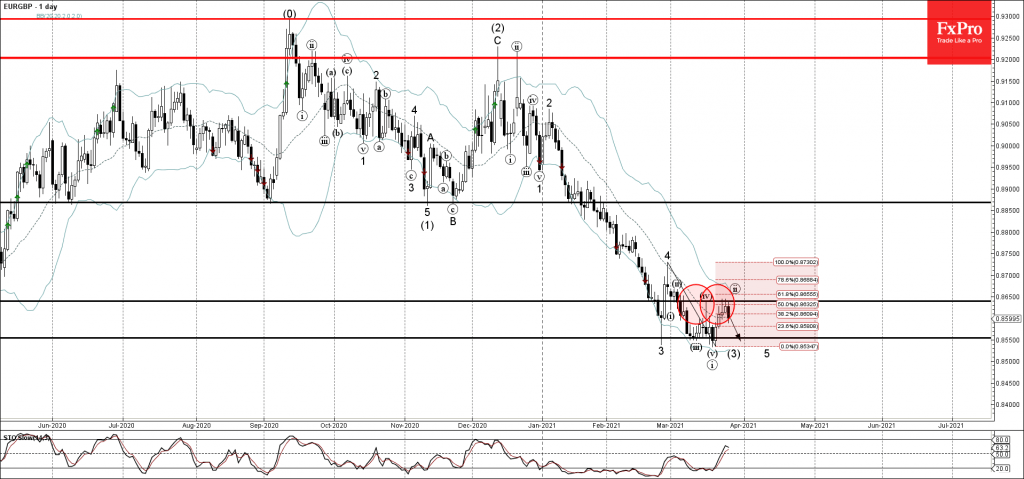
• EURGBP reversed from resistance level 0.8640

• Likely to reach support level 0.8550

EURGBP currency pair recently reversed down from the pivotal resistance level 0.8640 (which has been reversing the price from the start of March) – intersecting with the 50% Fibonacci correction of the downward impulse from February.

The downward reversal from the resistance level 0.8640 stopped the previous minor corrective wave (ii).

Given the clear daily downtrend and growing sterling bullishness – EURGBP is likely to fall further toward the next support level 0.8550 (which stopped multiple waves from February).

The FxPro Tech Analysis Team

The FxPro technical experts prepare a daily analysis of the most active currency pairs (majors, crosses, exotics) and commodities. Selected instruments are reviewed on daily trends (D1, H4), using the active Elliott Wave setups, Japanese candlesticks, indicators, and support/resistance levels.

Share
Published by
The FxPro Tech Analysis Team
Tags: EURGBP

Recent Posts

Bitcoin Wave Analysis – 14 January 2026

Bitcoin: ⬆️ Buy - Bitcoin broke resistance area - Likely to rise to resistance level…

6 hours ago

NZDJPY Wave Analysis – 14 January 2026

NZDJPY: ⬇️ Sell - NZDJPY reversed down from the resistance area - Likely to fall…

6 hours ago

What is Leverage?

Leverage is a mechanism that lets traders control larger positions using smaller capital. By choosing…

11 hours ago

The dollar does not tolerate dissent

US GDP growth is driven not by the White House, but by AI. The Bank…

16 hours ago

The crypto market has made a breakthrough

The crypto market surges, hitting new highs, with bullish sentiment for Bitcoin and Ethereum amid…

17 hours ago

Brent Crude oil Wave Analysis – 13 January 2026

Brent Crude oil ⬆️ Buy - Brent Crude oil rising inside impulse wave c -…

1 day ago

This website uses cookies