Categories: Technical analysis

EURGBP Wave Analysis – 25 June, 2020

EURGBP Wave Analysis – 25 June, 2020

• EURGBP reversed from resistance area
• Likely to fall to 0.8900

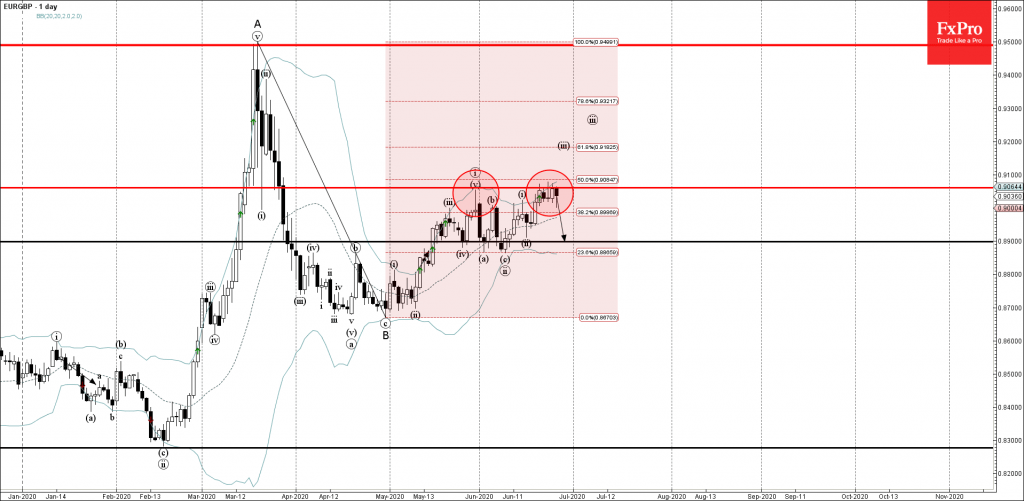
EURGBP recently reversed down from the resistance area lying between the resistance level 0.9065 (former monthly high from May), upper daily Bollinger Band and the 50% Fibonacci retracement of the previous downward B-wave from March.

The downward reversal from this resistance level stopped the earlier short-term impulse wave (iii).

EURGBP is likely to correct down further toward the next support level 0.8900 (low of the previous minor correction (ii)).

AddThis Website Tools
The FxPro Tech Analysis Team

The FxPro technical experts prepare a daily analysis of the most active currency pairs (majors, crosses, exotics) and commodities. Selected instruments are reviewed on daily trends (D1, H4), using the active Elliott Wave setups, Japanese candlesticks, indicators, and support/resistance levels.

Share
Published by
The FxPro Tech Analysis Team
Tags: EURGBP

Recent Posts

US sales jump gives USD relief, but is driven by fears

US Total retail sales rose 1.4% in March, beating the expected 1.3% after rising 0.2%…

10 minutes ago

Tariff news and resistance zone put pressure on crypto

The crypto market capitalisation decreased by 2.6% in 24 hours due to the announcement of…

3 hours ago

Gold Wave Analysis – 16 April 2025

Gold: ⬆️ Buy - Gold broke resistance zone - Likely to rise to the resistance…

7 hours ago

GBPUSD Wave Analysis – 16 April 2025

GBPUSD: ⬆️ Buy - GBPUSD broke key resistance level 1.3200 - Likely to rise to…

7 hours ago

Platinum Wave Analysis – 15 April 2025

Platinum: ⬆️ Buy - Platinum reversed from support level 905.00 - Likely to rise to…

17 hours ago

USDJPY Wave Analysis – 15 April 2025

USDJPY: ⬆️ Buy - USDJPY reversed from long-term support level 142.00 - Likely to rise…

17 hours ago