Categories: Technical analysis

EURGBP Wave Analysis – 25 January, 2019

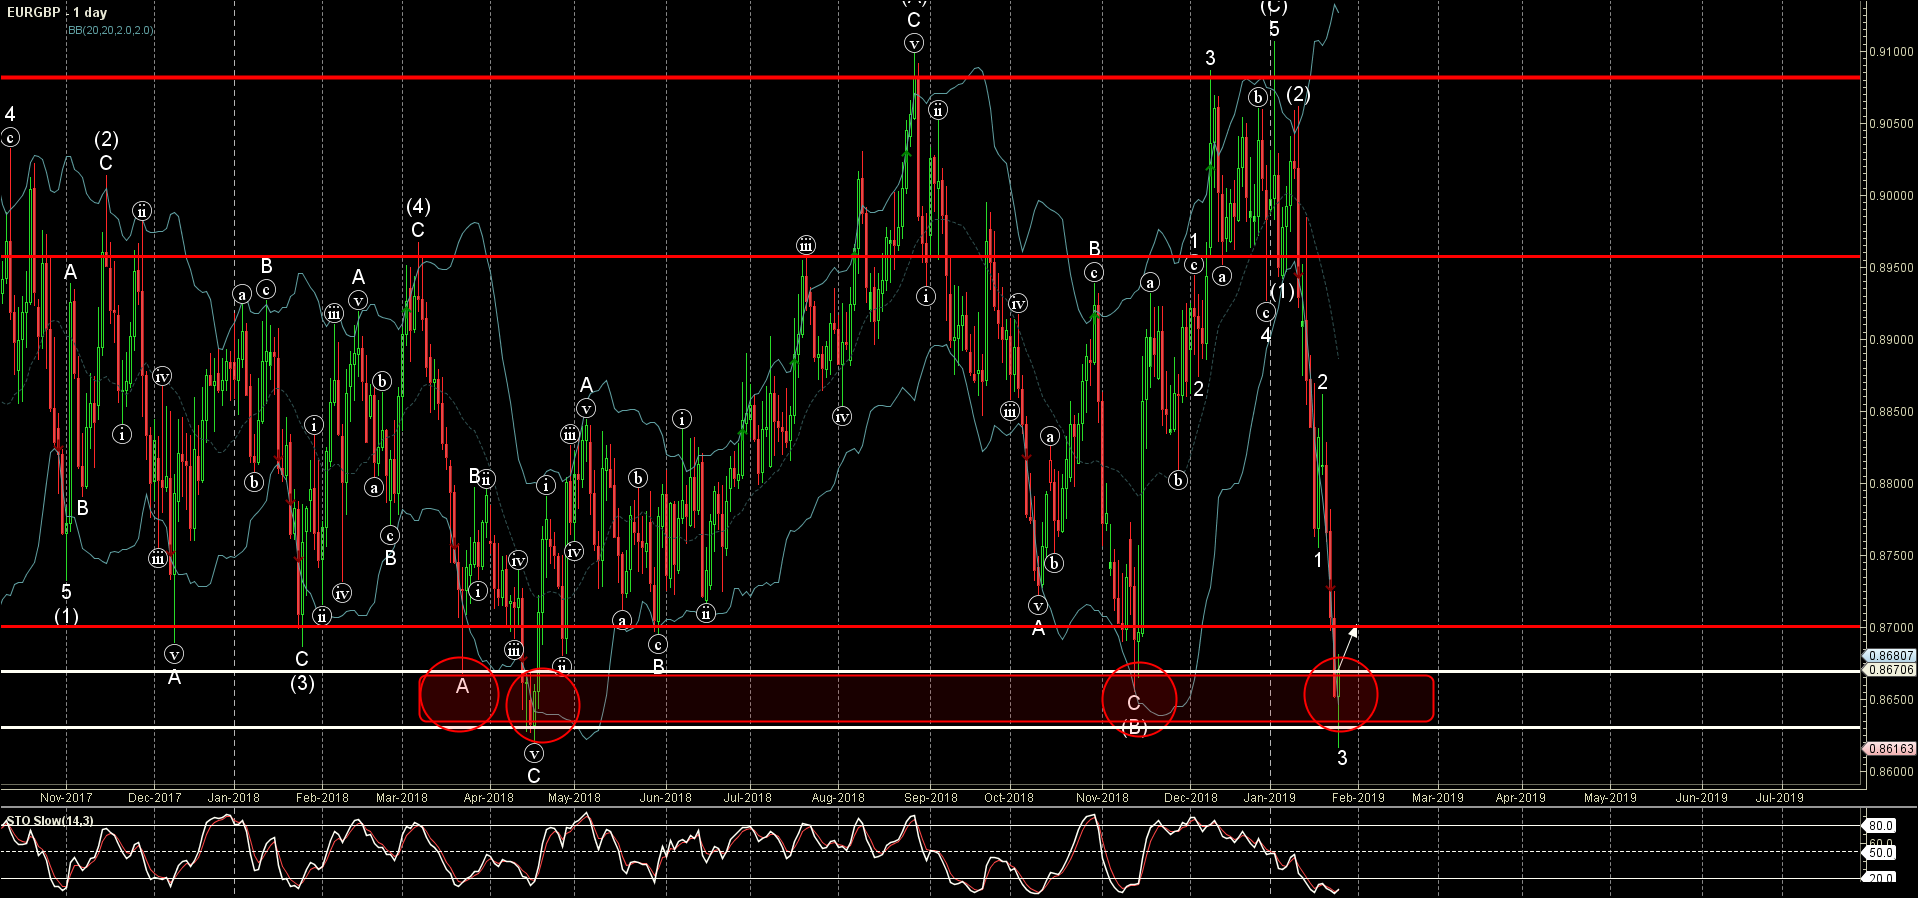
  • EURGBP reversed from support area
  • Further gains are likely

EURGBP recently reversed up from the support area located between the support levels 0.8630 and 0.8670 -, strengthened by the lower daily Bollinger Band.

The upward reversal from this support area stopped the previous short-term impulse wave 3 – which belongs to the impulse wave (D) from the start of January.

Given the oversold value of the daily Stochastic indicator – EURGBP is expected to rise further and re-test the next resistance level 0.8700.

The FxPro Tech Analysis Team

The FxPro technical experts prepare a daily analysis of the most active currency pairs (majors, crosses, exotics) and commodities. Selected instruments are reviewed on daily trends (D1, H4), using the active Elliott Wave setups, Japanese candlesticks, indicators, and support/resistance levels.

Share
Published by
The FxPro Tech Analysis Team
Tags: EURGBP

Recent Posts

ADP hints at another strong NFP on Friday  

The monthly ADP labour market report showed that America created 192K new jobs in April, above…

19 hours ago

Fed’s hawkish tone risks sinking S&P500 to 4700

Bears showed strength ahead of the FOMC decision.  U.S. indices sagged on Tuesday as investors…

23 hours ago

A new stage of Bitcoin’s decline

Market Picture  Bitcoin's closing price on Tuesday became the lowest since late February, confirming the…

1 day ago

Ebay Wave Analysis 30 April 2024

- Ebay under the bearish pressure - Likely to fall to support level 51.00 Ebay…

2 days ago

GBPAUD Wave Analysis 30 April 2024

- GBPAUD reversed from key support level 1.9135 - Likely to rise to resistance level…

2 days ago

Silver: a possible long road down

Silver has lost 2.6% since the start of the day on Tuesday to $26.4 per…

2 days ago

This website uses cookies