Categories: Technical analysis

EURGBP Wave Analysis 22 October 2024

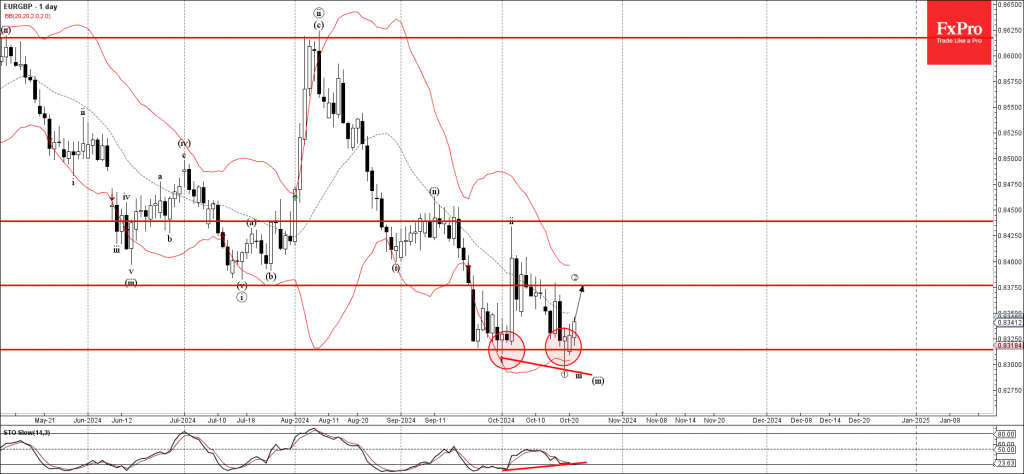
– EURGBP reversed from key support level 0.8315

– Likely to rise to resistance level 0.8375

EURGBP currency pair recently reversed up from the key support level 0.8315 (which reversed the pair multiple times in September) standing close to the lower daily Bollinger Band.

The upward reversal from the support level 0.8315 created the daily Japanese candlesticks reversal pattern Hammer Doji.

Given the strength of the support level 0.8315 and the bullish divergence on the daily Stochastic indicator, EURGBP currency pair can be expected to rise toward the next resistance level 0.8375, which reversed the pair earlier this month.

AddThis Website Tools
The FxPro Tech Analysis Team

The FxPro technical experts prepare a daily analysis of the most active currency pairs (majors, crosses, exotics) and commodities. Selected instruments are reviewed on daily trends (D1, H4), using the active Elliott Wave setups, Japanese candlesticks, indicators, and support/resistance levels.

Share
Published by
The FxPro Tech Analysis Team
Tags: EURGBP

Recent Posts

Adobe Wave Analysis – 13 March 2025

Adobe: ⬇️ Sell - Adobe broke round support level 400.00 - Likely to fall to…

14 hours ago

Apple Wave Analysis – 13 March 2025

Apple: ⬇️ Sell - Apple broke support area - Likely to fall to support level…

14 hours ago

Gold Wave Analysis – 13 March 2025

Gold: ⬆️ Buy - Gold broke resistance level 2962.00 - Likely to rise to resistance…

15 hours ago

EURGBP Wave Analysis – 13 March 2025

EURGBP: ⬇️ Sell - EURGBP reversed from key resistance level 0.8450 - Likely to fall…

15 hours ago

Gold climbs on lower rate speculations

The gold price has resumed updating its all-time highs on the back of speculations around…

21 hours ago

Crypto: just a bumpy downtrend

The crypto market experienced a drop, but towards the end of the week, there was…

22 hours ago