Categories: Technical analysis

EURGBP Wave Analysis 2 December 2024

– EURGBP reversed from support zone

– Likely to rise to resistance level 0.8325

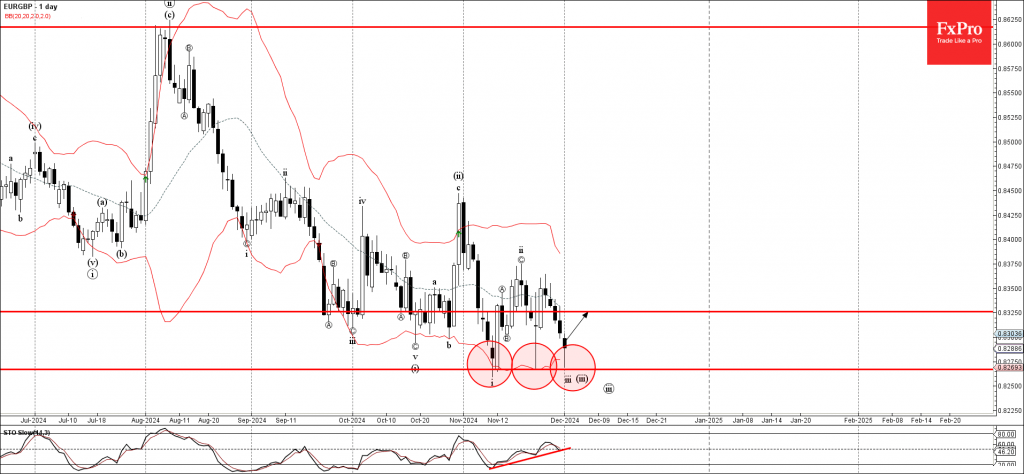
EURGBP currency pair today reversed up from the support zone located between the strong support level 0.8265 (which has been revering the pair from the start of November) and the lower daily Bollinger Band.

The upward reversal from this support zone stopped the earlier impulse waves iii and (iii) –which belong to the downward impulse sequence 1 from August.

Given the strength of the support level 0.8265 and the triple bullish divergence on the daily Stochastic indicator, EURGBP currency pair can be expected to rise to the next resistance level 0.8325.

The FxPro Tech Analysis Team

The FxPro technical experts prepare a daily analysis of the most active currency pairs (majors, crosses, exotics) and commodities. Selected instruments are reviewed on daily trends (D1, H4), using the active Elliott Wave setups, Japanese candlesticks, indicators, and support/resistance levels.

Share
Published by
The FxPro Tech Analysis Team
Tags: EURGBP

Recent Posts

Baidu Wave Analysis – 11 April 2025

Baidu: ⬆️ Buy - Baidu reversed from support zone - Likely to rise to resistance level…

2 days ago

USDCAD Wave Analysis – 11 April 2025

USDCAD: ⬇️ Sell - USDCAD broke support zone - Likely to fall to support level…

2 days ago

Video: Massive Market Reversal or Total Collapse? The Charts Are Screaming…

We break down one of the most dramatic weeks in the markets — including a…

3 days ago

US Dollar Suffers Amidst Inflation Data and Expectations

The US dollar is suffering due to weaker than expected inflation data and a surge…

3 days ago

USDJPY Wave Analysis – 11 April 2025

USDJPY: ⬇️ Sell - USDJPY broke the support zone - Likely to fall to support…

3 days ago

Bitcoin Wave Analysis – 11 April 2025

Bitcoin: ⬆️ Buy - Bitcoin reversed from support zone - Likely to rise to resistance…

3 days ago

This website uses cookies