Categories: Technical analysis

EURGBP Wave Analysis – 19 June, 2020

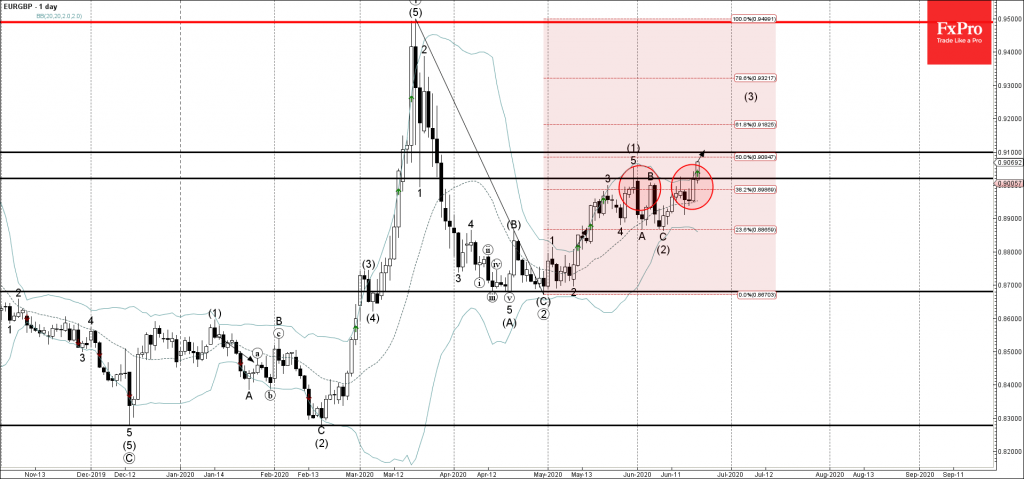
• EURGBP broke resistance zone

• Likely to rise to 0,9100

EURGBP today broke above the resistance zone lying between the key resistance level 0,9020 (which has been reversing the price from the end of May) and the 38.2% Fibonacci correction of the preceding ABC correction from march.

The breakout of this resistance zone continues the active medium-term upward impulse sequence (3) from the start of the month. EURGBP is likely to rise further toward the next resistance level 0,9100 (50% Fibonacci correction of the aforementioned ABC correction from march).

AddThis Website Tools
The FxPro Tech Analysis Team

The FxPro technical experts prepare a daily analysis of the most active currency pairs (majors, crosses, exotics) and commodities. Selected instruments are reviewed on daily trends (D1, H4), using the active Elliott Wave setups, Japanese candlesticks, indicators, and support/resistance levels.

Share
Published by
The FxPro Tech Analysis Team
Tags: EURGBP

Recent Posts

Video: Market Shake-Up! Dollar, Bitcoin & Gold on the Move – What’s Next?

Big moves are brewing in the markets! 📉📈 The US Dollar is forming a bottom,…

4 hours ago

Tesla Wave Analysis – 21 March 2025

Tesla: ⬆️ Buy - Tesla reversed from support level 220.00 - Likely to rise to…

3 days ago

Google Wave Analysis – 21 March 2025

Google: ⬆️ Buy - Google reversed from key support level 160.00 - Likely to rise…

3 days ago

Silver Wave Analysis – 21 March 2025

Silver: ⬇️ Sell - Silver reversed from resistance level 34.00 - Likely to fall to…

3 days ago

USDCHF Wave Analysis – 21 March 2025

USDCHF: ⬆️ Buy - USDCHF reversed from support level 0,8750 - Likely to fall to…

3 days ago

What’s next: Flash PMIs, UK CPI & US PCE

The week ahead includes the release of the PMI business activity indexes for March, the…

3 days ago