Categories: Technical analysis

EURGBP Wave Analysis – 18 December, 2019

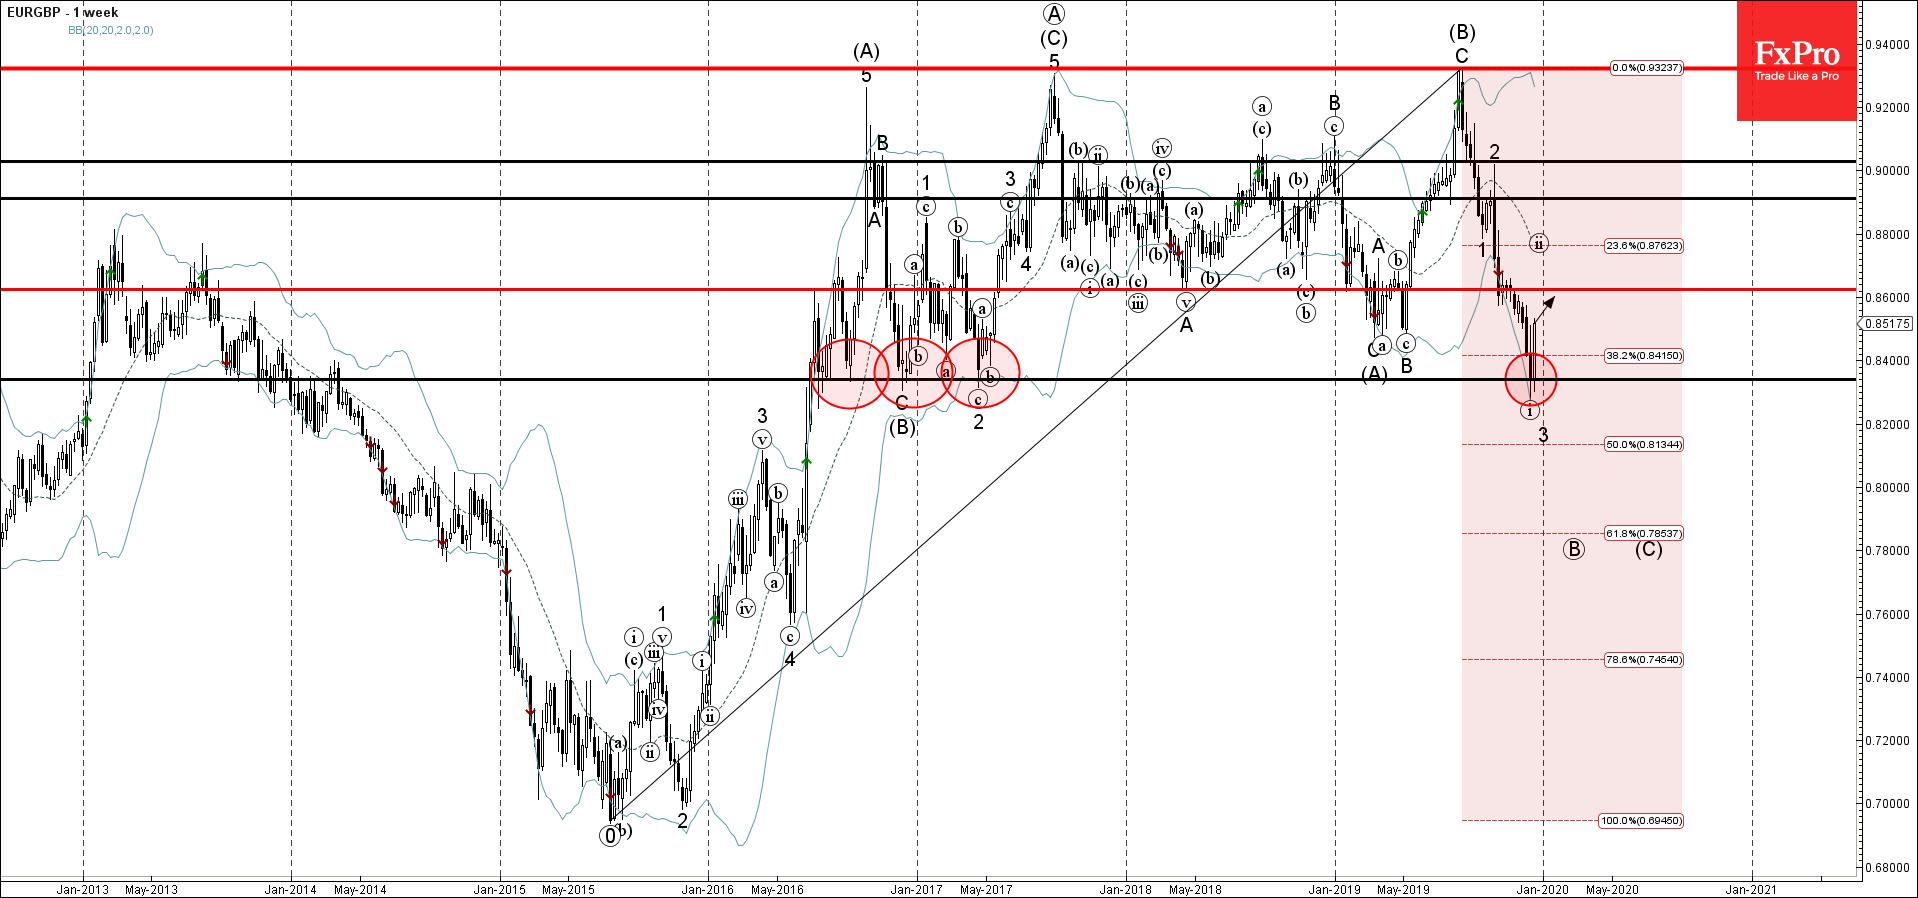
  • EURGBP reversed from support area
  • Likely to rise to 0.8600

EURGBP recently reversed up from the support area lying between the powerful, long-term support level 0.8340 (which has been reversing the price from May), lower daily Bollinger Band and the 38,2% Fibonacci correction of the previous upward price move from May.

The upward reversal from this support area started the active short-term correction 4.

EURGBP is expected to rise further toward the next resistance level 0.8600. Strong support remains at the support level 0.8340.

The FxPro Tech Analysis Team

The FxPro technical experts prepare a daily analysis of the most active currency pairs (majors, crosses, exotics) and commodities. Selected instruments are reviewed on daily trends (D1, H4), using the active Elliott Wave setups, Japanese candlesticks, indicators, and support/resistance levels.

Share
Published by
The FxPro Tech Analysis Team
Tags: EURGBP

Recent Posts

Apple Wave Analysis – 9 April 2025

Apple: ⬆️ Buy - Apple reversed from the support zone - Likely to rise to…

17 hours ago

EURGBP Wave Analysis – 9 April 2025

EURGBP: ⬆️ Buy - EURGBP broke the resistance zone - Likely to rise to resistance…

17 hours ago

Dollar pressured as markets are betting on a dovish Fed

The selling pressure on the US dollar is due to the sell-off in equities and…

17 hours ago

The crypto market has returned to this week’s lows

Crypto market cap fell 2% to $2.46 trillion in 24 hours, retesting the $2.40 trillion…

21 hours ago

Video: Bitcoin in Crisis. Will Crypto Bounce Back or Crash?

Bitcoin’s struggle continues, and the market’s rebound might not last. But what’s really driving the…

1 day ago

GBPCHF Wave Analysis – 8 April 2025

GBPCHF: ⬇️ Sell - GBPCHF broke the support zone - Likely to fall to support…

1 day ago

This website uses cookies