Categories: Technical analysis

EURGBP Wave Analysis – 16 June, 2020

• EURGBP reversed from resistance area
• Likely to fall 0.8865

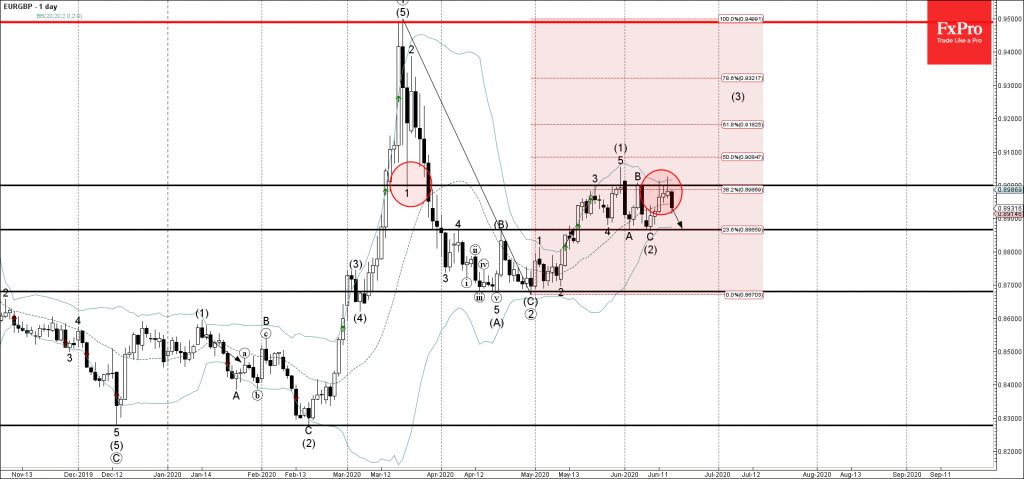
EURGBP recently reversed down from the resistance area lying between the round resistance level 0.9000 (which stopped the previous waves 3, (1) and B), upper daily Bollinger band and the 38.2% Fibonacci correction of the earlier downward wave from March.

The last downward reversal from this resistance area created the daily candlesticks reversal pattern Shooting Star.

EURGBP is likely to fall further toward the next support level 0.8865 (low of the pervious correction (2)).

The FxPro Tech Analysis Team

The FxPro technical experts prepare a daily analysis of the most active currency pairs (majors, crosses, exotics) and commodities. Selected instruments are reviewed on daily trends (D1, H4), using the active Elliott Wave setups, Japanese candlesticks, indicators, and support/resistance levels.

Share
Published by
The FxPro Tech Analysis Team
Tags: EURGBP

Recent Posts

USDJPY. Current situation #tradelikeapro #tradingstrategy #trandingshorts #usdjpy #usdjpytoday

Today is Monday, December 15th, and we're going to talk about the Japanese yen, where…

2 hours ago

ECB, BoE, and BoJ take different paths

Trump pushes for more Fed rate cuts, while no changes are expected from the ECB…

5 hours ago

Crypto Market Holds at $3T Amid Broken Uptrend

Crypto market stays near $3T amid correction, ETF inflows rise, sentiment weakens, and volatility expected…

6 hours ago

Gold Wave Analysis – 12 December 2025

Gold: ⬇️ Sell - Gold reversed from strong resistance level 4350.00 - Likely to fall to…

3 days ago

EURGBP Wave Analysis – 12 December 2025

EURGBP: ⬆️ Buy - EURGBP reversed from support zone - Likely to rise to resistance level…

3 days ago

Filecoin Wave Analysis – 12 December 2025

Filecoin: ⬇️ Sell - Filecoin broke key support level 1.435 - Likely to fall to support…

3 days ago

This website uses cookies