Categories: Technical analysis

EURGBP Wave Analysis 16 August 2024

– EURGBP broke support area

– Likely to fall to support level 0.8475

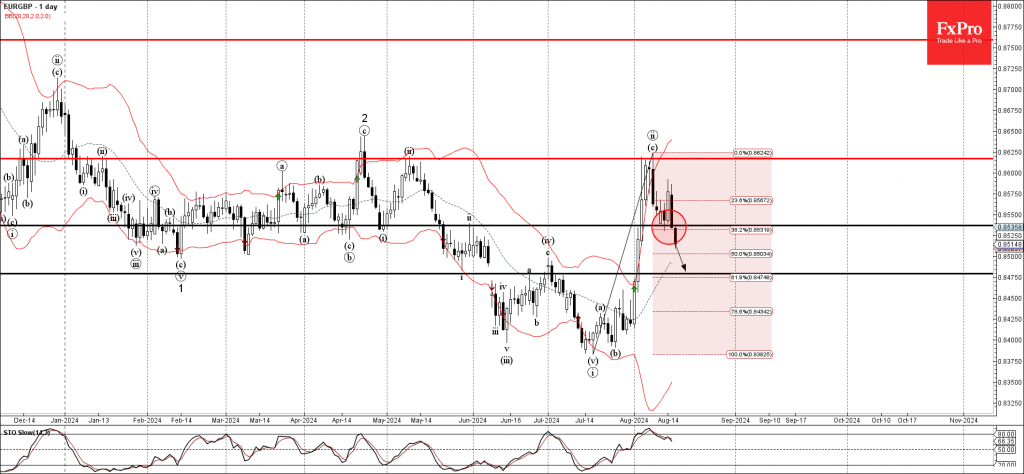
EURGBP currency pair just broke the support area set between the support level 0.8535 (which reversed the price twice earlier this week) and the 38.2% Fibonacci correction of the earlier sharp upward impulse from July.

The breakout of this support area is aligned with the clear multi-month downtrend seen on the daily EURGBP charts.

Given the strongly bullish sterling sentiment seen across the FX markets today, EURGBP currency pair can be expected to fall further toward the next support level 0.8475.

The FxPro Tech Analysis Team

The FxPro technical experts prepare a daily analysis of the most active currency pairs (majors, crosses, exotics) and commodities. Selected instruments are reviewed on daily trends (D1, H4), using the active Elliott Wave setups, Japanese candlesticks, indicators, and support/resistance levels.

Share
Published by
The FxPro Tech Analysis Team
Tags: EURGBP

Recent Posts

AUDCAD Wave Analysis 18 September 2024

- AUDCAD broke pivotal resistance level 0.9170 - Likely to rise to resistance level 0.9260…

6 hours ago

WTI Wave Analysis 18 September 2024

- WTI reversed from round resistance level 70.00 - Likely to fall to support level…

6 hours ago

Strong data didn’t derail markets from expectations of a 50bp Fed cut

US retail sales rose 0.1% m/m in August, better than forecast, but sales growth in…

14 hours ago

The crypto market gets a boost from stocks

Market Picture The crypto market has gained 2.1% in the last 24 hours to reach…

17 hours ago

MasterCard Wave Analysis 17 September 2024

- MasterCard broke round resistance level 500.00 - Likely to rise to the resistance level…

1 day ago

CHFJPY Wave Analysis 17 September 2024

- CHFJPY reversed from support zone - Likely to rise to the resistance level 168.45…

1 day ago

This website uses cookies