Categories: Technical analysis

EURGBP Wave Analysis – 13 July, 2022

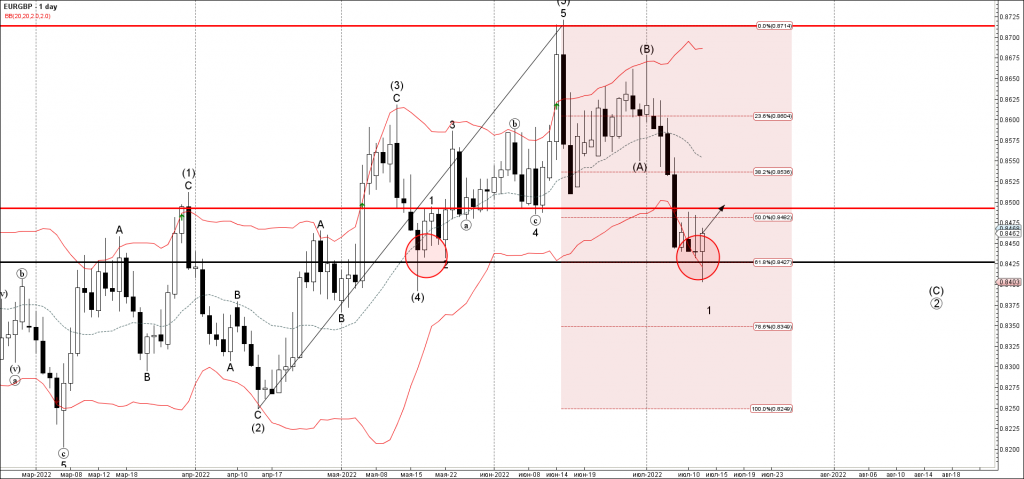
• EURGBP reversed from support level 0.8425

• Likely to rise to resistance level 0.85000

EURGBP today recently reversed up with the daily Hammer from the key support level 0.8425 (which has been reversing the pair from May), intersecting with the lower daily Bollinger Band and the 61.8% Fibonacci correction of the upward impulse from April.

The upward reversal from the support level 0.8425 stopped the previous minor downward impulse wave 1.

EURGBP can be expected to rise further toward the next resistance level 0.85000 (former monthly low from June).

AddThis Website Tools
The FxPro Tech Analysis Team

The FxPro technical experts prepare a daily analysis of the most active currency pairs (majors, crosses, exotics) and commodities. Selected instruments are reviewed on daily trends (D1, H4), using the active Elliott Wave setups, Japanese candlesticks, indicators, and support/resistance levels.

Share
Published by
The FxPro Tech Analysis Team
Tags: EURGBP

Recent Posts

Bitcoin Wave Analysis – 22 April 2025

Bitcoin: ⬆️ Buy - Bitcoin broke round resistance level 90000.00 - Likely to rise to…

8 hours ago

AUDUSD Wave Analysis – 22 April 2025

AUDUSD: ⬇️ Sell - AUDUSD reversed from the key resistance level 0.6400 - Likely to…

8 hours ago

Crypto Market Escapes from Fear

Market Overview The crypto market has gained around 2% over the past seven days, with…

20 hours ago

Nike Wave Analysis – 21 April 2025

Nike: ⬆️ Buy - Nike reversed from the long-term support level 52.60 - Likely to…

1 day ago

Natural Gas Wave Analysis – 21 April 2025

Natural gas: ⬇️ Sell Natural gas broke support area Likely to fall to support level…

1 day ago

EURUSD Wave Analysis – 21 April 2025

EURUSD: ⬆️ Buy - EURUSD broke the resistance area - Likely to test resistance level…

1 day ago