Categories: Technical analysis

EURGBP Wave Analysis 11 April 2024

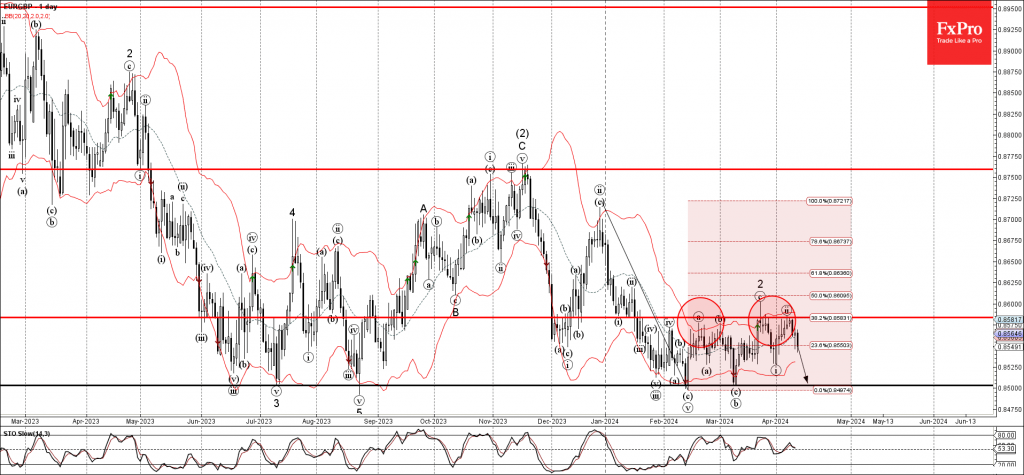
– EURGBP reversed from resistance level 0.8585

– Likely to fall to support level 0.8500

EURGBP currency pair recently reversed down from the pivotal resistance level 0.8585 (which has been reversing the price from February).

The resistance level 0.8585 was strengthened by the upper daily Bollinger Band and by the 38.2% Fibonacci correction of the downward impulse from December.

Given clear daily downtrend and the strongly bullish sterling sentiment, EURGBP currency pair can be expected to fall further to the next strong support level 0.8500 (which has been reversing the price from last July).

The FxPro Tech Analysis Team

The FxPro technical experts prepare a daily analysis of the most active currency pairs (majors, crosses, exotics) and commodities. Selected instruments are reviewed on daily trends (D1, H4), using the active Elliott Wave setups, Japanese candlesticks, indicators, and support/resistance levels.

Share
Published by
The FxPro Tech Analysis Team
Tags: EURGBP

Recent Posts

NZDCAD Wave Analysis – 7 January 2026

NZDCAD: ⬆️ Buy - NZDCAD reversed from support zone - Likely to rise to resistance…

10 hours ago

Bitcoin Wave Analysis – 7 January 2026

Bitcoin: ⬇️ Sell - Bitcoin reversed from resistance zone - Likely to fall to support…

10 hours ago

EURGBP Wave Analysis – 7 January 2026

EURGBP: ⬆️ Buy - EURGBP reversed from support zone - Likely to rise to resistance…

10 hours ago

Brent Crude Oil Wave Analysis – 7 January 2026

Brent Crude Oil: ⬇️ Sell - Brent Crude Oil reversed from resistance zone - Likely…

10 hours ago

Old fears about the euro have returned

The resurgence of the political crisis in France is weighing on EURUSD The US dollar…

19 hours ago

The crypto market has hit the upper limit of its rebound

The crypto market faces resistance at $3.2T; sentiment rises, but selling pressure persists. Bitcoin and…

22 hours ago

This website uses cookies