Categories: Technical analysis

EURGBP Wave Analysis 10 March, 2021

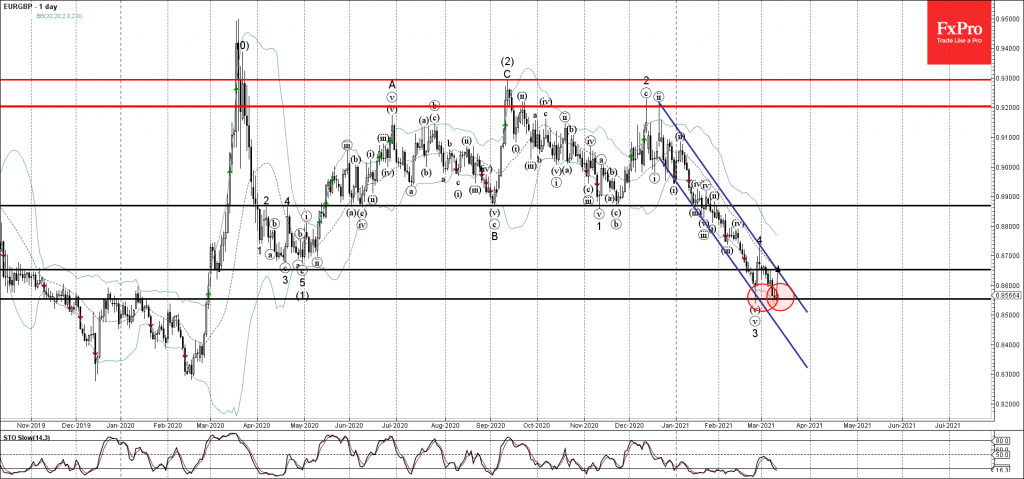
• EURGBP reversed from support area

• Likely to reach resistance level 0.8650

EURGBP recently reversed up from the support area surrounding the strong support level 0.8550 (which reversed the price with the daily Hammer at the end of February).

The support zone near the support level 0.8550 was strengthened by the lower daily Bollinger Band.

Given the strength of the support level 0.8550 and the bullish divergence on the daily Stochastic indicator EURGBP is likely to rise further toward the next resistance level 0.8650.

The FxPro Tech Analysis Team

The FxPro technical experts prepare a daily analysis of the most active currency pairs (majors, crosses, exotics) and commodities. Selected instruments are reviewed on daily trends (D1, H4), using the active Elliott Wave setups, Japanese candlesticks, indicators, and support/resistance levels.

Share
Published by
The FxPro Tech Analysis Team
Tags: EURGBP

Recent Posts

Bitcoin Wave Analysis – 14 January 2026

Bitcoin: ⬆️ Buy - Bitcoin broke resistance area - Likely to rise to resistance level…

9 hours ago

NZDJPY Wave Analysis – 14 January 2026

NZDJPY: ⬇️ Sell - NZDJPY reversed down from the resistance area - Likely to fall…

9 hours ago

What is Leverage?

Leverage is a mechanism that lets traders control larger positions using smaller capital. By choosing…

14 hours ago

The dollar does not tolerate dissent

US GDP growth is driven not by the White House, but by AI. The Bank…

20 hours ago

The crypto market has made a breakthrough

The crypto market surges, hitting new highs, with bullish sentiment for Bitcoin and Ethereum amid…

20 hours ago

Brent Crude oil Wave Analysis – 13 January 2026

Brent Crude oil ⬆️ Buy - Brent Crude oil rising inside impulse wave c -…

1 day ago

This website uses cookies