Categories: Technical analysis

EURGBP Wave Analysis – 04 April, 2019

  • EURGBP reversed from support area
  • Further gains are likely

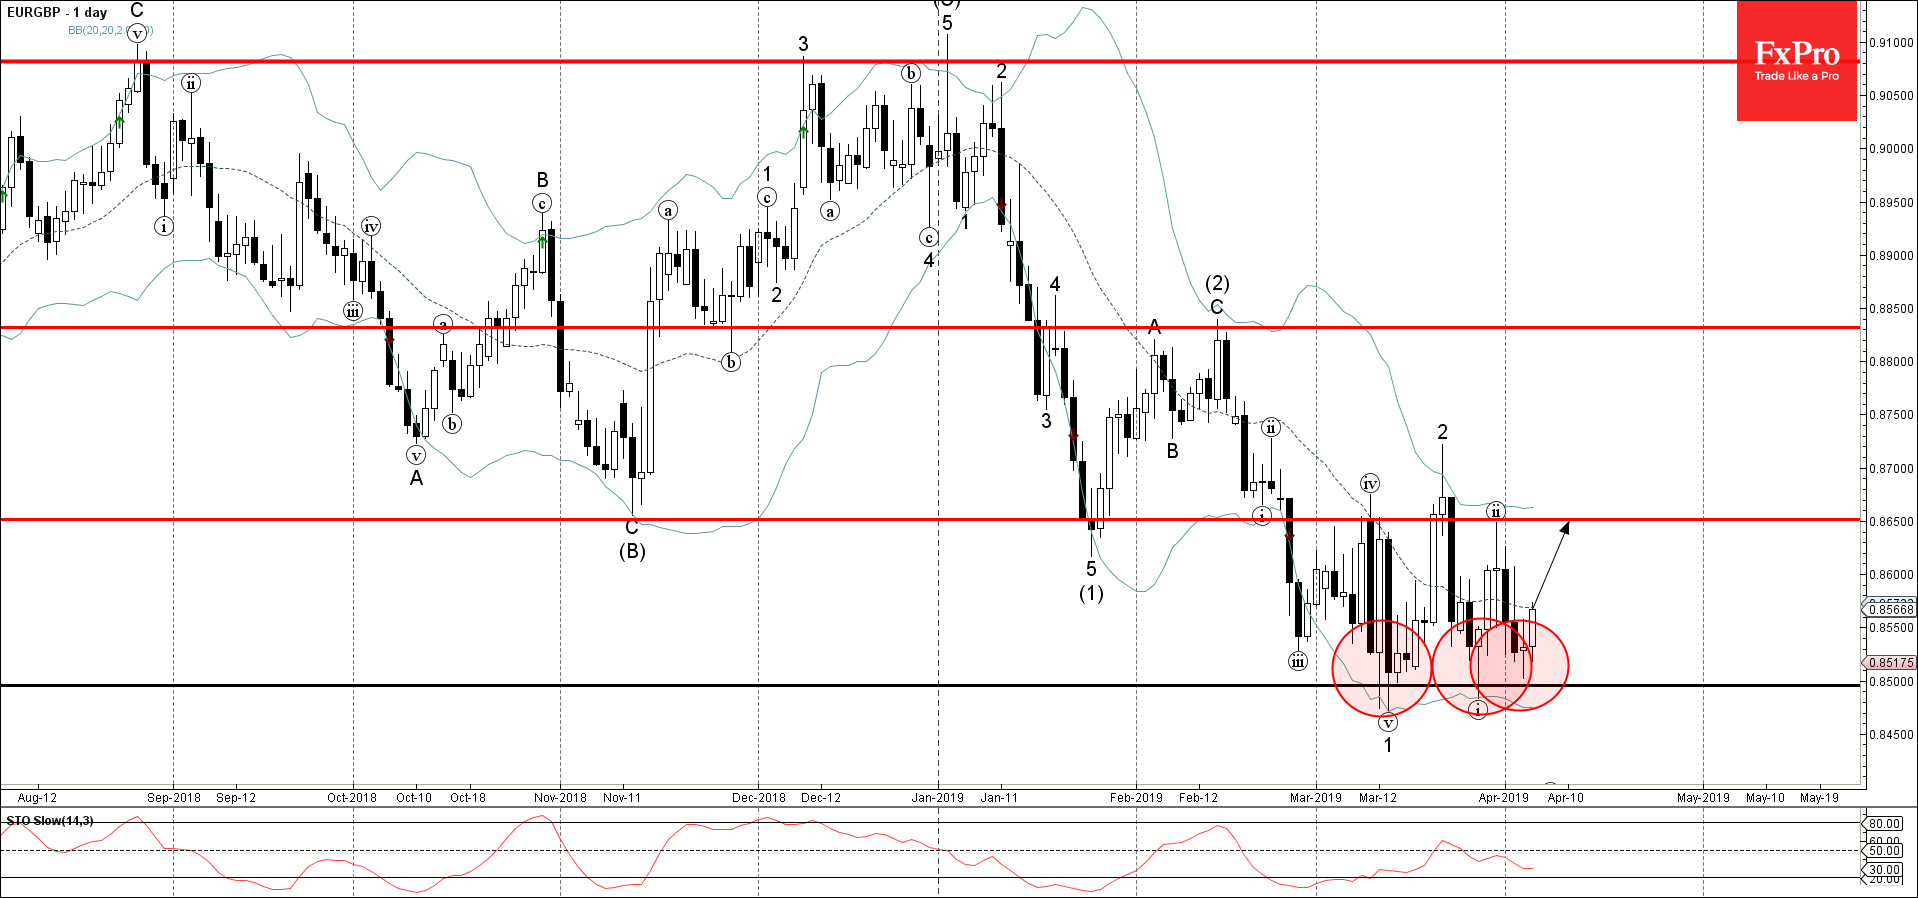
EURGBP recently reversed up from the support area lying between the pivotal support level 0.8500 (which has been reversing the price from the middle of March) and lower daily Bollinger Band.

The upward reversal from this support area is likely to create the daily Japanese candlesticks reversal pattern Morning Star – similar to the one the pair created at the end of last month.

EURGBP is expected to rise further and re-test the next resistance level 0.8650 (top of the previous correction (ii)).

The FxPro Tech Analysis Team

The FxPro technical experts prepare a daily analysis of the most active currency pairs (majors, crosses, exotics) and commodities. Selected instruments are reviewed on daily trends (D1, H4), using the active Elliott Wave setups, Japanese candlesticks, indicators, and support/resistance levels.

Share
Published by
The FxPro Tech Analysis Team
Tags: EURGBP

Recent Posts

Gold Wave Analysis 19 September 2024

- Gold reversed from support level 2550.00 - Likely to rise to resistance level 2600.00…

3 hours ago

S&P 500 Wave Analysis 19 September 2024

- S&P 500 broke key resistance level 5670.00 - Likely to rise to resistance level…

3 hours ago

The Fed’s big rate and projections cut

The Fed cut the rate by 50 bps, This change was not fully factored into…

9 hours ago

Crypto market climbs out of the pit

The crypto market as a whole and Bitcoin hit three-week highs, but are still in…

16 hours ago

AUDCAD Wave Analysis 18 September 2024

- AUDCAD broke pivotal resistance level 0.9170 - Likely to rise to resistance level 0.9260…

1 day ago

WTI Wave Analysis 18 September 2024

- WTI reversed from round resistance level 70.00 - Likely to fall to support level…

1 day ago

This website uses cookies