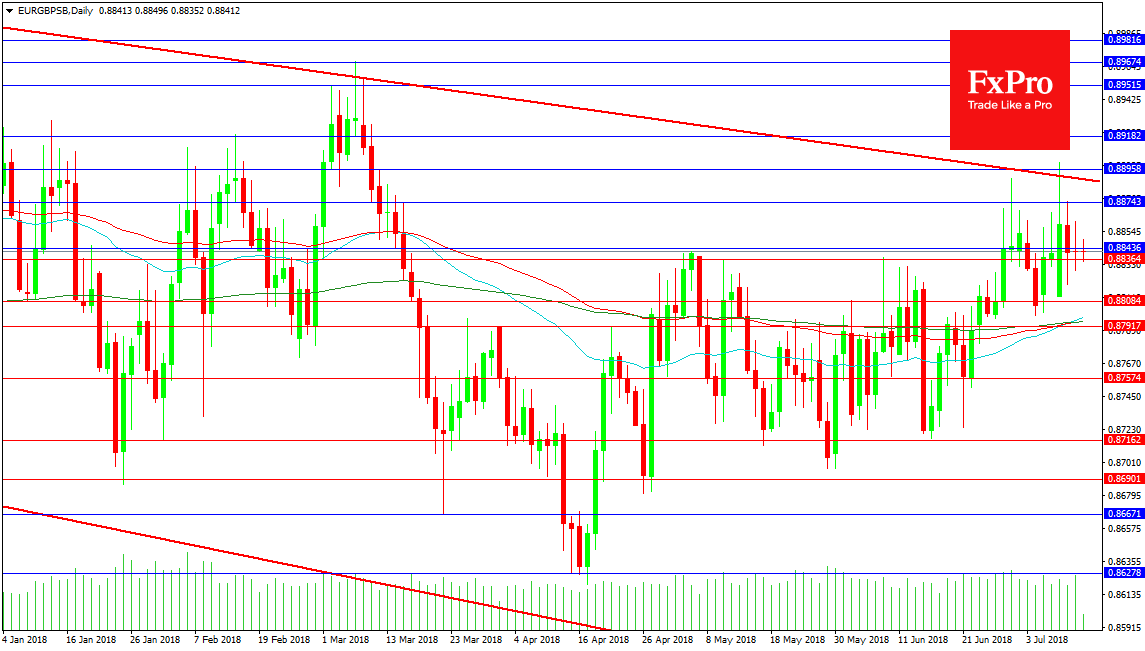
The EURGBP pair is in an uptrend on the daily since the 17th of April and the low created at 0.86203. The price has eked out higher highs and lows and advanced to Monday’s high at 0.89000. A break above this area could change the playing field and try to advance the chart to the 0.90000 area. This would require a turn back higher from current levels and a confirmed break of trend line resistance at 0.88873. There is light resistance at 0.88743 also with the March high at 0.89674.

Support for the pair can be found at the 0.88000 area followed by the moving average cluster around 0.87950. A break under this zone could see price wallow under 0.88000 for a further considerable period. But it should be noted that the 50 and 100 DMAs are crossing above the 200 DMA creating a Golden cross and potential pointing to higher prices. If this is disregarded by markets the swing low at 0.87162 becomes a crucial area of support if a deeper selloff to lower levels is to be avoided.

The FxPro Analyst Team

Our team consists of financial market experts. Our dedicated professionals prepare reviews on the foreign exchange market situation, Crude Oil, Gold and Stock Indices. All the analysts are regularly published in the world leading economic media.

Share
Published by
The FxPro Analyst Team
Tags: EURGBP

Recent Posts

Adobe Wave Analysis 3 May 2024

- Adobe reversed from support zone - Likely to rise to resistance level 500.00 Adobe…

6 hours ago

EURGBP Wave Analysis 3 May 2024

- EURJPY reversed from support zone - Likely to rise to resistance level 0.8625 EURGBP…

6 hours ago

How Low Can the USDJPY Go?

USDJPY was slipping below 153 on Friday morning, a three-week low and having lost over…

13 hours ago

Bitcoin’s Downtrend, Solana and Ethereum Form Double Bottom

Market picture  Crypto market capitalisation rose 3.3% in 24 hours to $2.22 trillion. Local capitalisation…

19 hours ago

EURJPY Wave Analysis 2 May 2024

- EURJPY under strong bearish pressure - Likely to fall to support level 163.10 EURJPY…

1 day ago

WTI crude oil Wave Analysis 2 May 2024

- WTI broke round support level 80.00 - Likely to fall to support level 76.00…

1 day ago

This website uses cookies