Categories: Technical analysis

EURCHF Wave Analysis 8 April 2024

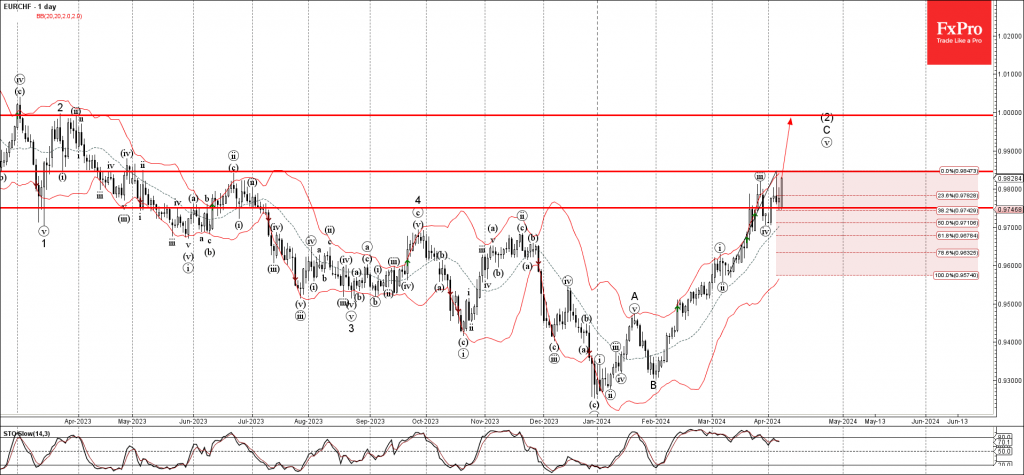
– EURCHF reversed from support level 0.9750

– Likely to rise to resistance level 0.9845 and 1

EURCHF rising after the recent upward reversal from the support level 0.9750 intersecting with the 38.2% Fibonacci correction of the upward impulse from the start of March.

The upward reversal from this support level 0.9750 continues the C-wave of the active intermediate ABC correction (2) from January.

Given the string Swiss franc sales, EURCHF can be expected to rise further to the next resistance level 0.9845 (multi month high from June) – followed by parity (target for the completion of the active impulse wave C).

AddThis Website Tools
The FxPro Tech Analysis Team

The FxPro technical experts prepare a daily analysis of the most active currency pairs (majors, crosses, exotics) and commodities. Selected instruments are reviewed on daily trends (D1, H4), using the active Elliott Wave setups, Japanese candlesticks, indicators, and support/resistance levels.

Share
Published by
The FxPro Tech Analysis Team
Tags: EURCHF

Recent Posts

Bitcoin Wave Analysis – 22 April 2025

Bitcoin: ⬆️ Buy - Bitcoin broke round resistance level 90000.00 - Likely to rise to…

5 hours ago

AUDUSD Wave Analysis – 22 April 2025

AUDUSD: ⬇️ Sell - AUDUSD reversed from the key resistance level 0.6400 - Likely to…

5 hours ago

Crypto Market Escapes from Fear

Market Overview The crypto market has gained around 2% over the past seven days, with…

17 hours ago

Nike Wave Analysis – 21 April 2025

Nike: ⬆️ Buy - Nike reversed from the long-term support level 52.60 - Likely to…

1 day ago

Natural Gas Wave Analysis – 21 April 2025

Natural gas: ⬇️ Sell Natural gas broke support area Likely to fall to support level…

1 day ago

EURUSD Wave Analysis – 21 April 2025

EURUSD: ⬆️ Buy - EURUSD broke the resistance area - Likely to test resistance level…

1 day ago