Categories: Technical analysis

EURCHF Wave Analysis 31 December 2024

– EURCHF reversed from resistance zone

– Likely to fall to support level 0.9350

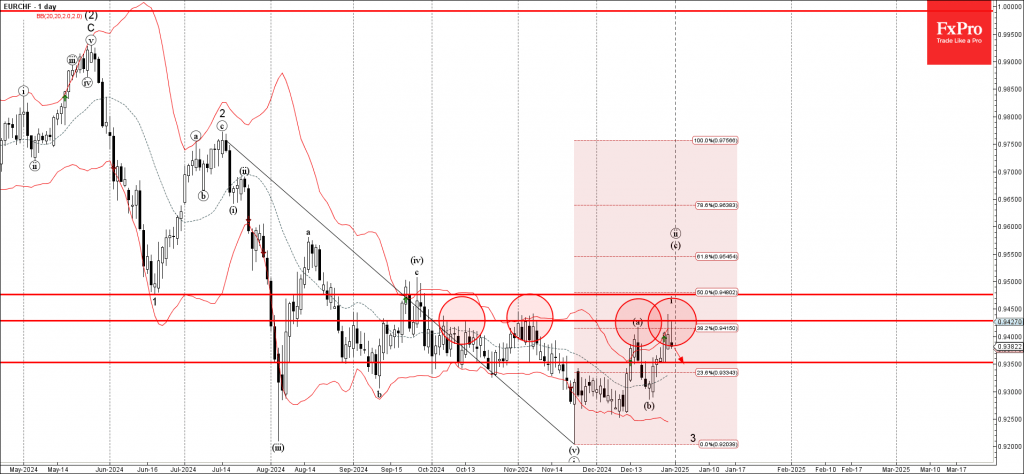
EURCHF currency pair today reversed down from the resistance area located between pivotal resistance level 0.9430 (which has been steadily reversing the price from the start of October) intersecting with the upper daily Bollinger Band.

The downward reversal from the resistance level 0.9430 will create the daily Shooting Star candlesticks reversal pattern – if the pair closes today near the current levels.

Given the predominant daily downtrend, EURCHF currency pair can be expected to fall to the next support level 0.9350.

The FxPro Tech Analysis Team

The FxPro technical experts prepare a daily analysis of the most active currency pairs (majors, crosses, exotics) and commodities. Selected instruments are reviewed on daily trends (D1, H4), using the active Elliott Wave setups, Japanese candlesticks, indicators, and support/resistance levels.

Share
Published by
The FxPro Tech Analysis Team
Tags: EURCHF

Recent Posts

Nikkei 225 Wave Analysis – 4 April 2025

Nikkei 225: ⬇️ Sell - Nikkei 225 broke support zone - Likely to fall to…

2 days ago

Gold Wave Analysis – 4 April 2025

Gold: ⬇️ Sell - Gold broke daily up channel - Likely to fall to support…

2 days ago

Video Pro News Weekly

The U.S. dollar takes a major hit as trade tariffs spark capital flight, while global…

3 days ago

Mad Gold and Crude Oil

Gold experienced a significant increase followed by a sharp decline. It may be a good…

3 days ago

The US index’s demise has accelerated after confirming the downtrend

US indices fell after tough tariffs were announced by Trump, triggering a negative reaction in…

3 days ago

Tariff wars made the dollar a risky asset

The US dollar is experiencing a decline due to trade tariffs and capital flight. The…

3 days ago

This website uses cookies