Categories: Technical analysis

EURCHF Wave Analysis – 2 June, 2020

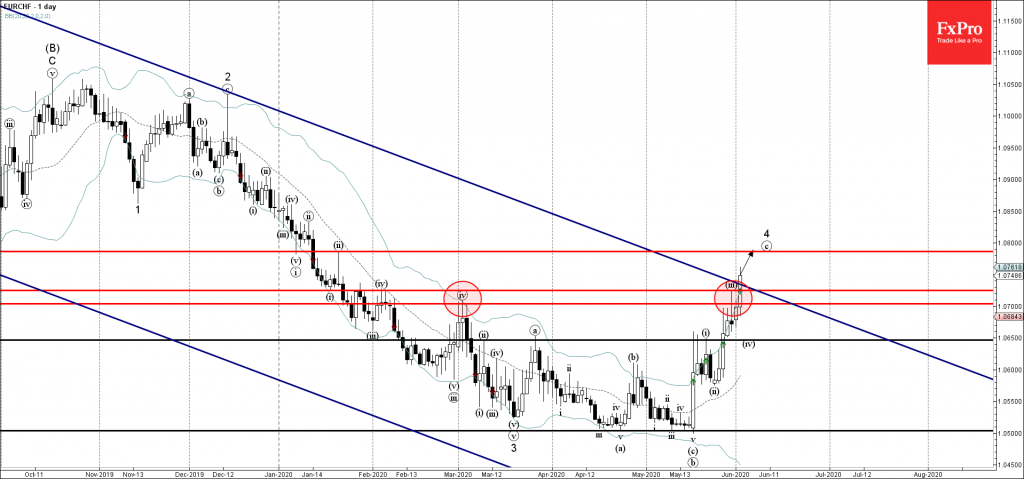
• EURCHF broke resistance level 1.0700

• Likely to rise to 1.0785

EURCHF recently broke through the resistance zone lying between the resistance level 1.0700 (monthly high from March) and the resistance trendline of the wide weekly down channel from 2019.

The breakout of this resistance zone accelerated the active short-term impulse wave (c) which belongs to wave 4 from the middle of March.

EURCHF is expected to rise further toward the next resistance level 1.0785 (target price for the completion of the active impulse wave (c)).

The FxPro Tech Analysis Team

The FxPro technical experts prepare a daily analysis of the most active currency pairs (majors, crosses, exotics) and commodities. Selected instruments are reviewed on daily trends (D1, H4), using the active Elliott Wave setups, Japanese candlesticks, indicators, and support/resistance levels.

Share
Published by
The FxPro Tech Analysis Team
Tags: EURCHF

Recent Posts

Brent crude oil Wave Analysis 17 May 2024

- Brent crude oil reversed from key support level 81.00 - Likely to test resistance…

24 hours ago

Silver Wave Analysis 17 May 2024

- Silver broke multi-year resistance level 29.50 - Likely to reach resistance level 32.00 Silver…

24 hours ago

The dollar index clings to the uptrend

The US dollar is not giving up without a fight, gaining for the second day…

1 day ago

After surpassing $30, silver may aim for $50

Silver climbed above $29.8, rewriting the highs from January 2021, but once again faced selling…

1 day ago

The crypto market is ready to grow further

Market picture The crypto market cooled off on Thursday afternoon, but on Friday morning, buyers…

1 day ago

Amazon Wave Analysis 16 May 2024

- Amazon reversed from resistance level 190.00 - Likely to fall to support level 180.00…

2 days ago

This website uses cookies