Categories: Technical analysis

EURCHF Wave Analysis 18 March 2024

– EURCHF under bullish pressure

 – Likely to rise to resistance level 0.968

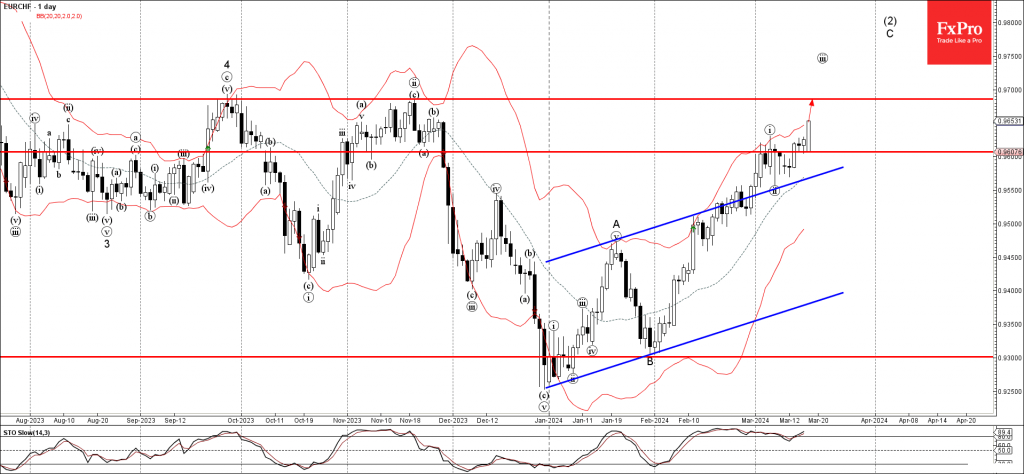
EURCHF under the bullish pressure after the pair broke the key resistance level 0.9600 (which stopped the previous impulse wave i at the start of March).

The breakout of the resistance level 0.9600 accelerated the C-wave of the active intermediate ABC correction (2) from the end of December.

Given the clear daily uptrend and strong Swiss franc sales, EURCHF currency pair can be expected to rise further toward the next resistance level 0.9685 (earlier monthly high from September and November).

AddThis Website Tools
The FxPro Tech Analysis Team

The FxPro technical experts prepare a daily analysis of the most active currency pairs (majors, crosses, exotics) and commodities. Selected instruments are reviewed on daily trends (D1, H4), using the active Elliott Wave setups, Japanese candlesticks, indicators, and support/resistance levels.

Share
Published by
The FxPro Tech Analysis Team
Tags: EURCHF

Recent Posts

The Rapid Assault on Crypto

The cryptocurrency market experienced a significant surge, with market capitalisation reaching $2.95 trillion. Bitcoin is…

2 hours ago

Bitcoin Wave Analysis – 22 April 2025

Bitcoin: ⬆️ Buy - Bitcoin broke round resistance level 90000.00 - Likely to rise to…

17 hours ago

AUDUSD Wave Analysis – 22 April 2025

AUDUSD: ⬇️ Sell - AUDUSD reversed from the key resistance level 0.6400 - Likely to…

17 hours ago

Crypto Market Escapes from Fear

Market Overview The crypto market has gained around 2% over the past seven days, with…

1 day ago

Nike Wave Analysis – 21 April 2025

Nike: ⬆️ Buy - Nike reversed from the long-term support level 52.60 - Likely to…

2 days ago

Natural Gas Wave Analysis – 21 April 2025

Natural gas: ⬇️ Sell Natural gas broke support area Likely to fall to support level…

2 days ago