Categories: Technical analysis

EURCHF Wave Analysis – 17 February, 2020

  • EURCHF reversed from strong support area
  • Likely to rise to 1,0800

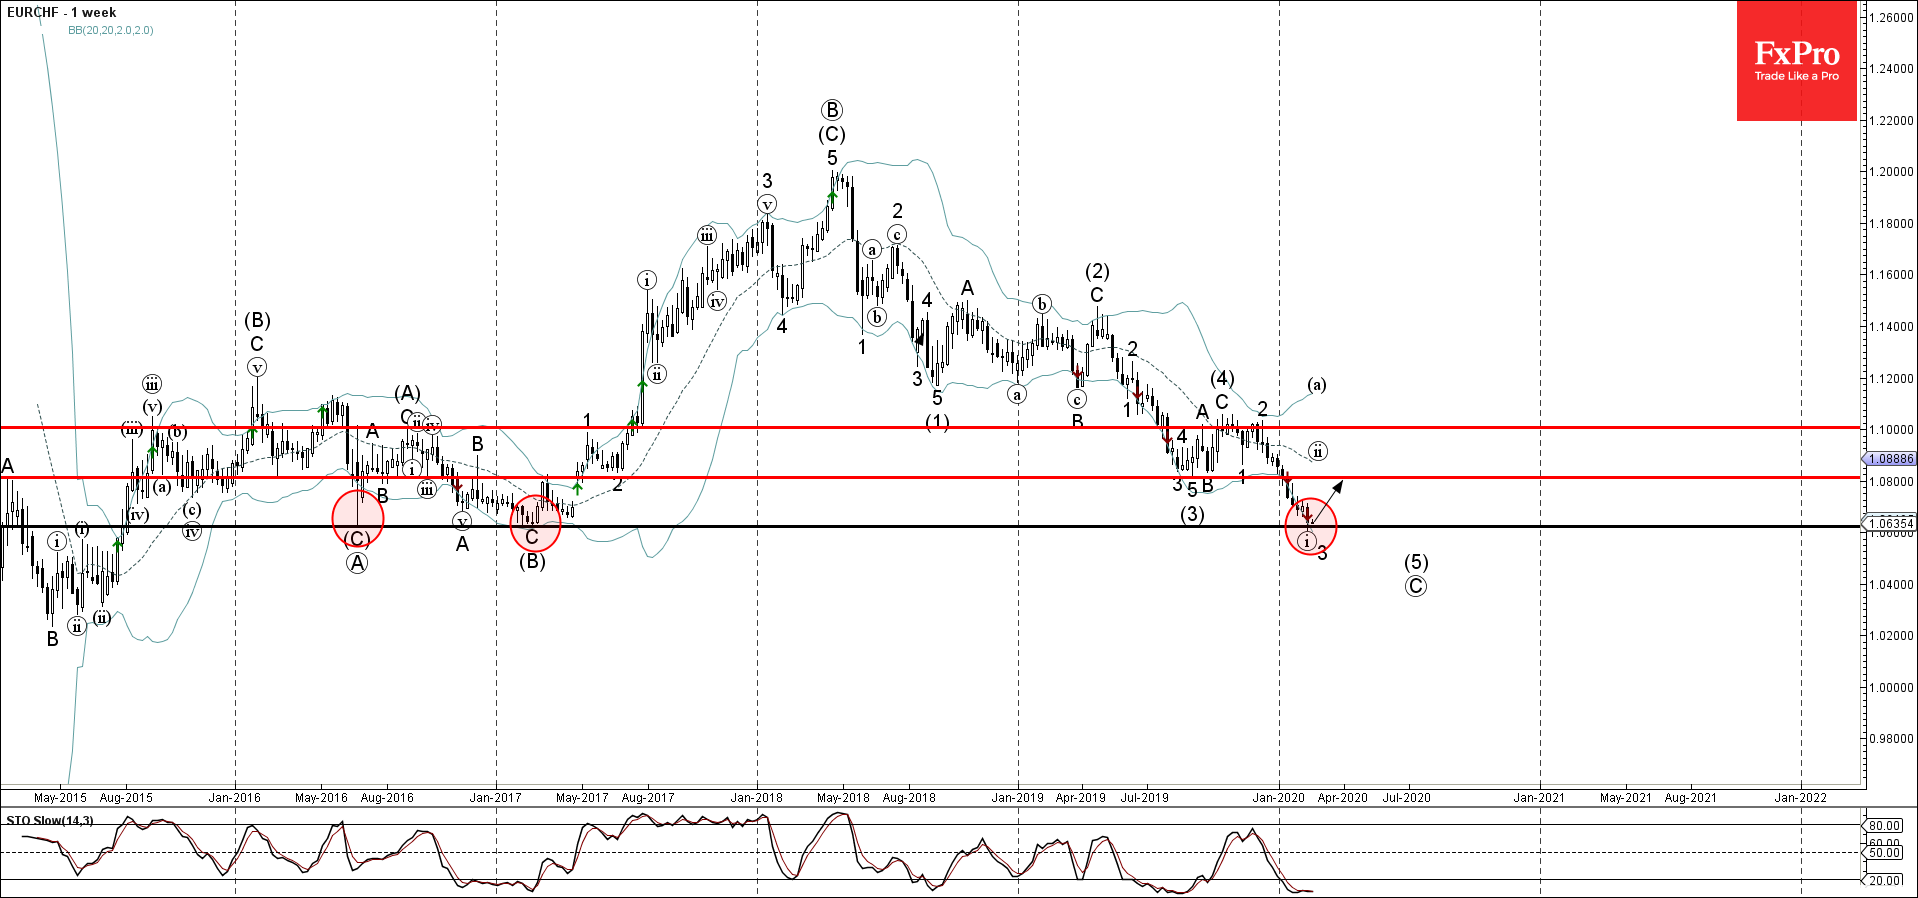
EURCHF recently reversed up from the strong support area lying between the long-term support level 1.0620 (which has been reversing the price from the middle of May) and the lower weekly Bollinger Band.

The upward reversal from this from the support area started the active weekly medium-term correction (ii).

Given the oversold reading on the weekly Stochastic indicator – EURCHF is likely to rise further toward the next resistance level 1,0800 (former strong support from last year).

AddThis Website Tools
The FxPro Tech Analysis Team

The FxPro technical experts prepare a daily analysis of the most active currency pairs (majors, crosses, exotics) and commodities. Selected instruments are reviewed on daily trends (D1, H4), using the active Elliott Wave setups, Japanese candlesticks, indicators, and support/resistance levels.

Share
Published by
The FxPro Tech Analysis Team
Tags: EURCHF

Recent Posts

USDJPY Wave Analysis – 24 March 2025

USDJPY: ⬆️ Buy - USDJPY broke the resistance zone - Likely to rise to the…

33 minutes ago

Dow Jones Wave Analysis – 24 March 2025

Dow Jones: ⬆️ Buy - Dow Jones reversed from support zone - Likely to rise…

34 minutes ago

Bitcoin pushes up from 200-day MA

Bitcoin pushed back from its 200-day low, with the crypto market capitalization rising to $2.86…

4 hours ago

Video: Market Shake-Up! Dollar, Bitcoin & Gold on the Move – What’s Next?

Big moves are brewing in the markets! 📉📈 The US Dollar is forming a bottom,…

9 hours ago

Tesla Wave Analysis – 21 March 2025

Tesla: ⬆️ Buy - Tesla reversed from support level 220.00 - Likely to rise to…

3 days ago

Google Wave Analysis – 21 March 2025

Google: ⬆️ Buy - Google reversed from key support level 160.00 - Likely to rise…

3 days ago