Categories: Technical analysis

EURCHF Wave Analysis 16 March, 2021

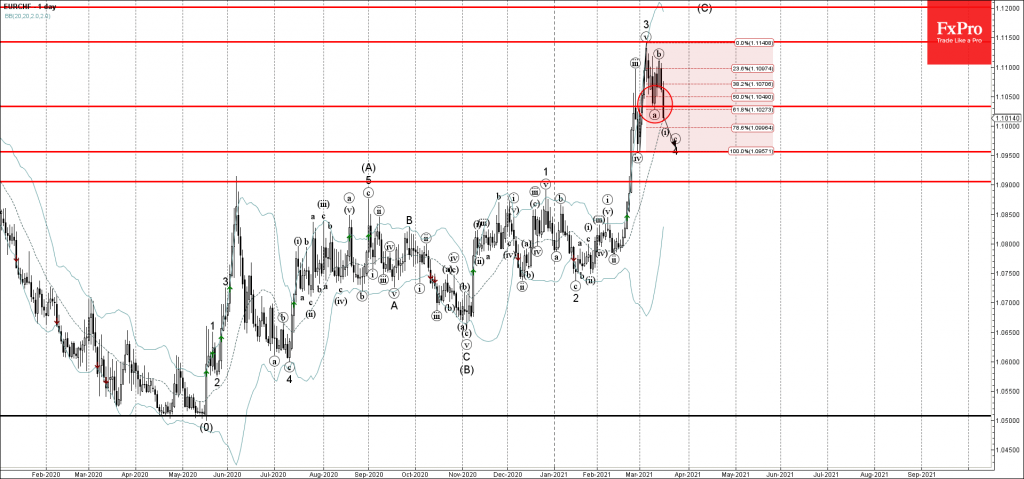
• EURCHF broke support level 1.1030

• Likely to reach support level 1.0955

EURCHF currency pair recently broke the support level 1.1030 (low of the previous correction (a)) – standing near the 61.8% Fibonacci correction level of the previous upward impulse wave (v) from last month.

The breakout of the support level 1.1030 accelerated the active short-term impulse wave (c) of the ABC correction 4 from the start of March.

EURCHF is likely to fall further toward the next support 1.0955 (low of wave (iv) and the target for the completion of the active wave 4).

The FxPro Tech Analysis Team

The FxPro technical experts prepare a daily analysis of the most active currency pairs (majors, crosses, exotics) and commodities. Selected instruments are reviewed on daily trends (D1, H4), using the active Elliott Wave setups, Japanese candlesticks, indicators, and support/resistance levels.

Share
Published by
The FxPro Tech Analysis Team
Tags: EURCHF

Recent Posts

The dollar does not tolerate dissent

US GDP growth is driven not by the White House, but by AI. The Bank…

7 hours ago

The crypto market has made a breakthrough

The crypto market surges, hitting new highs, with bullish sentiment for Bitcoin and Ethereum amid…

8 hours ago

Brent Crude oil Wave Analysis – 13 January 2026

Brent Crude oil ⬆️ Buy - Brent Crude oil rising inside impulse wave c -…

21 hours ago

USDJPY Wave Analysis – 13 January 2026

USDJPY ⬆️ Buy - USDJPY broke resistance area - Likely to rise to resistance level…

21 hours ago

Exxon Mobil Wave Analysis – 13 January 2026

Exxon Mobil ⬆️ Buy - Exxon Mobil broke resistance level 125.60 - Likely to rise…

21 hours ago

BNB Wave Analysis – 13 January 2026

Brent Crude oil ⬆️ Buy - BNB broke out of sideways price range - Likely…

21 hours ago

This website uses cookies