Categories: Technical analysis

EURCHF Wave Analysis 15 January 2024

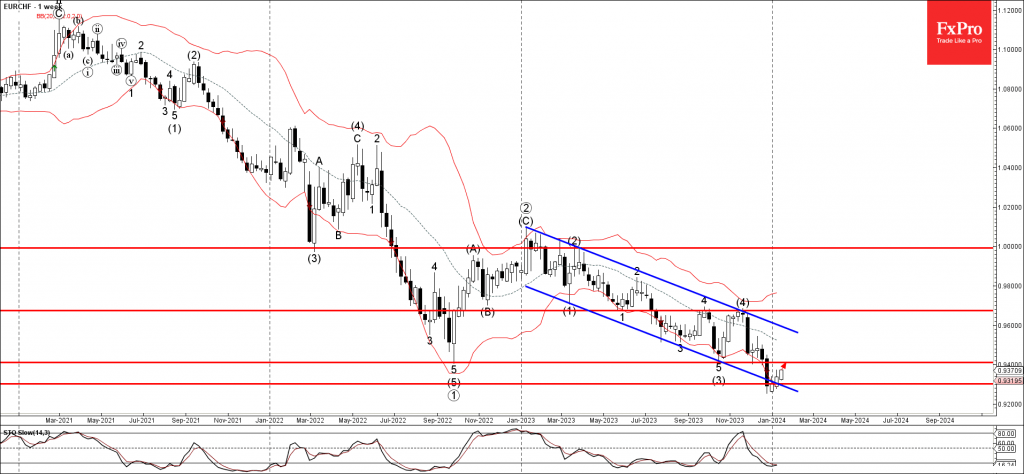
– EURCHF reversed from support level 0.9300

– Likely to rise to resistance level 0.9400

EURCHF currency pair recently reversed up from the key support level 0.9300 (intersecting with the lower weekly Bollinger Band and the support trendline of the weekly down channel from the start of 2023).

The upward reversal from the support level 0.9300 stopped the previous downward weekly impulse wave (5) from the end of last year.

Given the oversold daily and weekly Stochastic, EURCHF currency pair can be expected to rise further to the next resistance level 0.9400 (former low of wave (3) from last year).

AddThis Website Tools
The FxPro Tech Analysis Team

The FxPro technical experts prepare a daily analysis of the most active currency pairs (majors, crosses, exotics) and commodities. Selected instruments are reviewed on daily trends (D1, H4), using the active Elliott Wave setups, Japanese candlesticks, indicators, and support/resistance levels.

Share
Published by
The FxPro Tech Analysis Team
Tags: EURCHF

Recent Posts

S&P 500 Wave Analysis – 1 April 2025

S&P 500: ⬆️ Buy - S&P 500 reversed from support area - Likely to rise…

4 hours ago

GBPAUD Wave Analysis – 1 April 2025

GBPAUD: ⬇️ Sell - GBPAUD reversed from long-term resistance level 2.0820 - Likely to fall…

4 hours ago

Crypto’s Attempt to Stabilise

The cryptocurrency market has experienced some volatility, with a 1.1% rise in 24 hours and…

17 hours ago

NIO Wave Analysis – 31 March 2025

NIO: ⬆️ Buy - NIO reversed from support zone - Likely to rise to resistance…

1 day ago

Nvidia Wave Analysis – 31 March 2025

Nvidia: ⬆️ Buy - Nvidia reversed from key support level 105.00 - Likely to rise…

1 day ago

Markets rattled on consumer sentiment

Consumer sentiment index from the University of Michigan shows alarming information for stock indices, with…

1 day ago