Categories: Technical analysis

EURCHF Wave Analysis 13 January, 2021

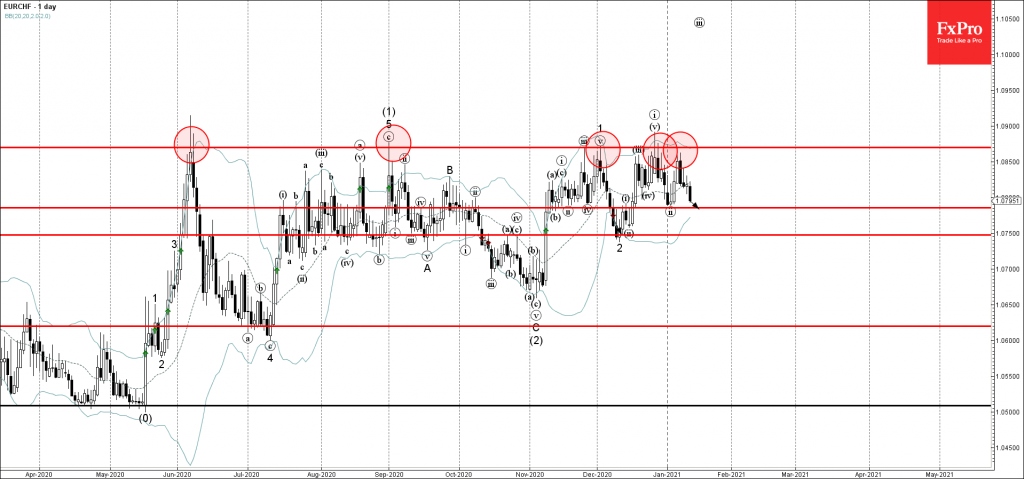
• EURCHF reversed from resistance area

• Likely to test next support level 1.0785

EURCHF continues to fall after the price reversed down from the resistance area lying between the resistance level 1.0870 (which has been reversing the price from June) – standing close to the upper daily Bollinger Band.

The downward reversal from this resistance area created the daily reversal pattern Bearish Engulfing.

EURCHF is likely to fall further toward the next support level 1.0785 (low of the previous minor corrective wave (ii)).

The FxPro Tech Analysis Team

The FxPro technical experts prepare a daily analysis of the most active currency pairs (majors, crosses, exotics) and commodities. Selected instruments are reviewed on daily trends (D1, H4), using the active Elliott Wave setups, Japanese candlesticks, indicators, and support/resistance levels.

Share
Published by
The FxPro Tech Analysis Team
Tags: EURCHF

Recent Posts

How Low Can the USDJPY Go? 

USDJPY was slipping below 153 on Friday morning, a three-week low and having lost over…

6 hours ago

Bitcoin’s Downtrend, Solana and Ethereum Form Double Bottom

Market picture  Crypto market capitalisation rose 3.3% in 24 hours to $2.22 trillion. Local capitalisation…

11 hours ago

EURJPY Wave Analysis 2 May 2024

- EURJPY under strong bearish pressure - Likely to fall to support level 163.10 EURJPY…

1 day ago

WTI crude oil Wave Analysis 2 May 2024

- WTI broke round support level 80.00 - Likely to fall to support level 76.00…

1 day ago

ADP hints at another strong NFP on Friday

The monthly ADP labour market report showed that America created 192K new jobs in April, above…

2 days ago

Fed’s hawkish tone risks sinking S&P500 to 4700

Bears showed strength ahead of the FOMC decision.  U.S. indices sagged on Tuesday as investors…

2 days ago

This website uses cookies