Categories: Technical analysis

EURCAD Wave Analysis 6 December 2024

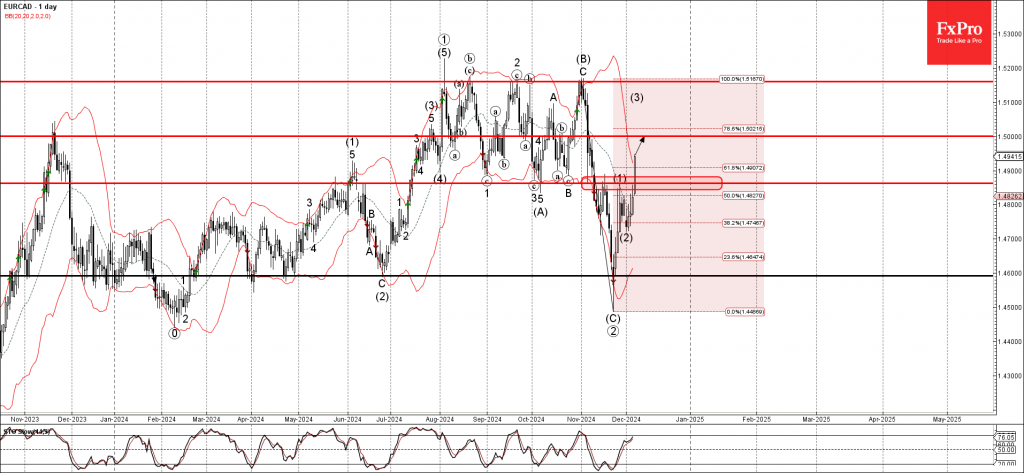
– EURCAD broke resistance zone

– Likely to rise to resistance level 1.5000

EURCAD currency pair recently broke the resistance zone located between the resistance level 1.4865 (which has been reversing the pair from the middle of November) and the 50% Fibonacci correction of the downward impulse wave C.

The breakout of this resistance zone accelerated the active intermediate impulse wave (C).

Given the clear daily uptrend and the strongly bearish CAD sentiment seen today, EURCAD currency pair can be expected to rise toward the next round resistance level 1.5000.

The FxPro Tech Analysis Team

The FxPro technical experts prepare a daily analysis of the most active currency pairs (majors, crosses, exotics) and commodities. Selected instruments are reviewed on daily trends (D1, H4), using the active Elliott Wave setups, Japanese candlesticks, indicators, and support/resistance levels.

Share
Published by
The FxPro Tech Analysis Team
Tags: EURCAD

Recent Posts

Baidu Wave Analysis – 11 April 2025

Baidu: ⬆️ Buy - Baidu reversed from support zone - Likely to rise to resistance level…

2 days ago

USDCAD Wave Analysis – 11 April 2025

USDCAD: ⬇️ Sell - USDCAD broke support zone - Likely to fall to support level…

2 days ago

Video: Massive Market Reversal or Total Collapse? The Charts Are Screaming…

We break down one of the most dramatic weeks in the markets — including a…

3 days ago

US Dollar Suffers Amidst Inflation Data and Expectations

The US dollar is suffering due to weaker than expected inflation data and a surge…

3 days ago

USDJPY Wave Analysis – 11 April 2025

USDJPY: ⬇️ Sell - USDJPY broke the support zone - Likely to fall to support…

3 days ago

Bitcoin Wave Analysis – 11 April 2025

Bitcoin: ⬆️ Buy - Bitcoin reversed from support zone - Likely to rise to resistance…

3 days ago

This website uses cookies