Categories: Technical analysis

EURCAD Wave Analysis 6 August 2024

– EURCAD reversed from resistance level 1.5110

– Likely to fall to support level 1.5000

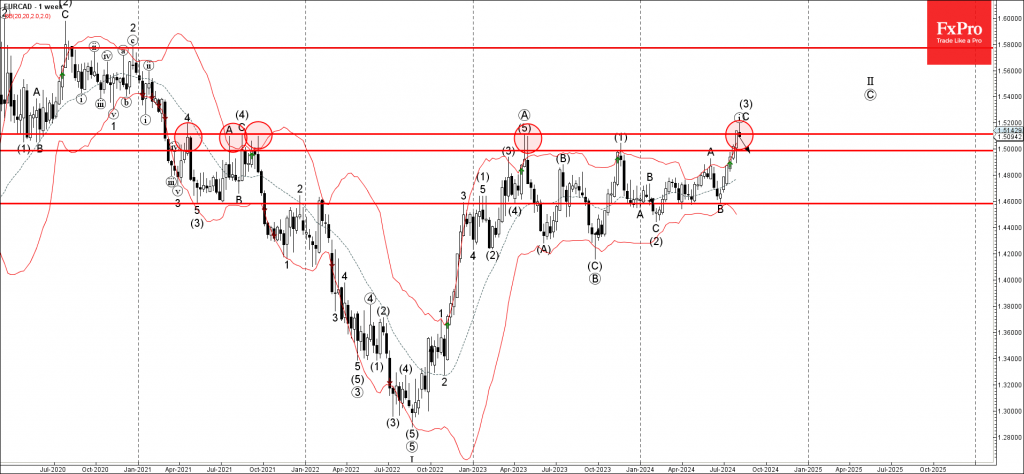
EURCAD currency pair recently reversed down from the long-term resistance level 1.5110 (which has been reversing the price from the start of 2011), standing close to the upper weekly Bollinger Band.

The downward reversal from the resistance level 1.5110 created the weekly Japanese candlesticks reversal pattern Shooting Star.

Given the strength of the resistance level 1.5110 and the overbought daily Stochastic, EURCAD currency pair can be expected to fall further toward the next round support level 1.5000 (former resistance from the end of 2023).

The FxPro Tech Analysis Team

The FxPro technical experts prepare a daily analysis of the most active currency pairs (majors, crosses, exotics) and commodities. Selected instruments are reviewed on daily trends (D1, H4), using the active Elliott Wave setups, Japanese candlesticks, indicators, and support/resistance levels.

Share
Published by
The FxPro Tech Analysis Team
Tags: EURCAD

Recent Posts

Solana Wave Analysis – 5 December 2025

Solana: ⬇️ Sell - Solana reversed from resistance zone - Likely to fall to support…

37 minutes ago

EURAUD Wave Analysis – 5 December 2025

EURAUD : ⬇️ Sell - EURAUD broke the support level 1.7600 - Likely to fall…

38 minutes ago

Forex has set its priorities

In 2026, experts favour the yen, see modest euro growth, and expect pressure on the…

5 hours ago

Bear market rebound in crypto is likely to continue

Crypto rebounds continue; Bitcoin faces resistance, with a mixed market outlook ahead, as regulatory changes…

6 hours ago

Coca-Cola Wave Analysis – 4 December 2025

Coca-Cola: ⬇️ Sell - Coca-Cola reversed from long-term resistance level 73.25 - Likely to fall to…

19 hours ago

DraftKings Wave Analysis – 4 December 2025

DraftKings: ⬆️ Buy - DraftKings reversed from support zone - Likely to rise to resistance level…

19 hours ago

This website uses cookies