Categories: Technical analysis

EURCAD Wave Analysis – 5 June, 2020

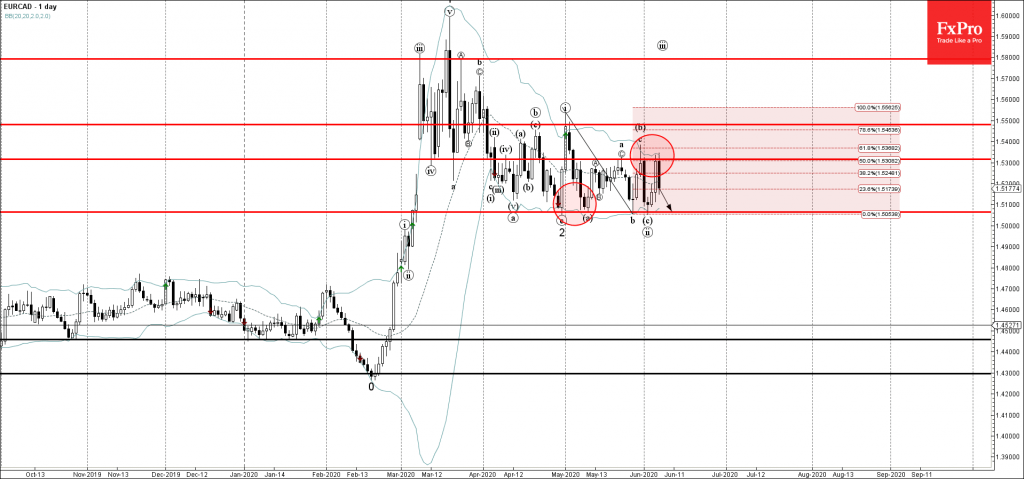
• EURCAD reversed from resistance area

• Likely to fall to 1.5065

EURCAD recently reversed down from the resistance area lying between the key resistance level 1.530 (which has been reversing the price from May) and the upper daily Bollinger Band.

This resistance area was further strengthened by the 50% Fibonacci correction of the previous downward impulse from the start of May.

EURCAD is likely to fall further toward the next support level 1.5065 (which has been steadily reversing this currency pair from the end of April).

AddThis Website Tools
The FxPro Tech Analysis Team

The FxPro technical experts prepare a daily analysis of the most active currency pairs (majors, crosses, exotics) and commodities. Selected instruments are reviewed on daily trends (D1, H4), using the active Elliott Wave setups, Japanese candlesticks, indicators, and support/resistance levels.

Share
Published by
The FxPro Tech Analysis Team
Tags: EURCAD

Recent Posts

AUDNZD Wave Analysis – 20 March 2025

AUDNZD: ⬆️ Buy - AUDNZD reversed from key support level 1.0930 - Likely to rise…

10 minutes ago

EURCAD Wave Analysis – 20 March 2025

EURCAD: ⬇️ Sell - EURCAD reversed from the resistance zone - Likely to fall to…

13 minutes ago

Crypto Market Testing Resistance

The crypto market has increased by over 5% and is nearing the $2.9 trillion. The…

5 hours ago

Gold Wave Analysis – 19 March 2025

Gold: ⬆️ Buy - Gold continues daily uptrend - Likely to rise to resistance level…

19 hours ago

EURJPY Wave Analysis – 19 March 2025

EURJPY: ⬇️ Sell - EURJPY reversed from resistance zone - Likely to fall to support…

19 hours ago

NZDUSD Wave Analysis – 19 March 2025

NZDUSD: ⬇️ Sell - NZDUSD reversed from the resistance level 0.5820 - Likely to fall…

1 day ago