Categories: Technical analysis

EURCAD Wave Analysis 3 October 2024

– EURCAD reversed from key support level 1.4900

– Likely to rise to resistance level 1.5150

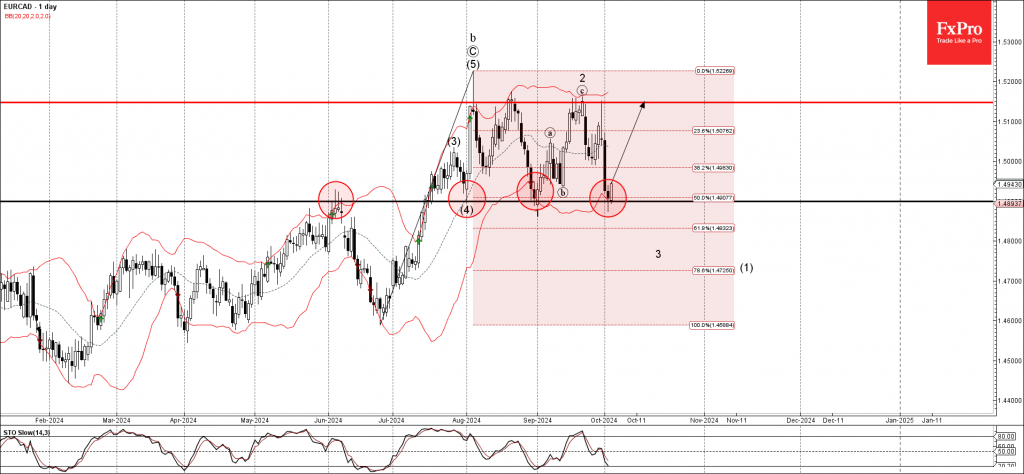
EURCAD currency pair recently reversed up from the key support level 1.4900 (former resistance from June, which stopped the previous waves (4) and 1) intersecting with the lower daily Bollinger Band and the 50% Fibonacci correction of the sharp upward impulse from June.

The upward reversal from the support level 1.4900 created the daily Japanese candlesticks reversal pattern Hammer.

Given the clear daily uptrend, EURCAD currency pair can be expected to rise further to the next resistance level 1.5150 (top of wave 2 from last month).

The FxPro Tech Analysis Team

The FxPro technical experts prepare a daily analysis of the most active currency pairs (majors, crosses, exotics) and commodities. Selected instruments are reviewed on daily trends (D1, H4), using the active Elliott Wave setups, Japanese candlesticks, indicators, and support/resistance levels.

Share
Published by
The FxPro Tech Analysis Team
Tags: EURCAD

Recent Posts

EURAUD Wave Analysis 3 October 2024

EURAUD reversed from strong support level 1.6020 Likely to rise to resistance level 1.6260 EURAUD…

4 hours ago

Dollar Growth or Just a Rebound? NFP Holds the Key

The Dollar Index is rising for the fourth consecutive day, gaining over 1.7%, and is…

5 hours ago

The crypto market is still falling, but Bitcoin has already stabilised

The crypto market lost 1.44% of its capitalisation in 24 hours to $2.13 trillion amid…

10 hours ago

WTI Wave Analysis 2 October 2024

- WTI reversed from pivotal resistance level 71.30 - Likely to fall to support level…

1 day ago

Apple Wave Analysis 2 October 2024

- Apple reversed from support level 225.00 - Likely to rise to resistance level 232.50…

1 day ago

The Hang Seng Is Too Hot Now, but Long-Term Attractive

The Hang Seng is up 9.6% from its closing level on 30th September, the second…

1 day ago

This website uses cookies