Categories: Technical analysis

EURCAD Wave Analysis 3 December, 2020

• EURCAD broke key resistance level 1.5660

• Likely to rise to 1.5745

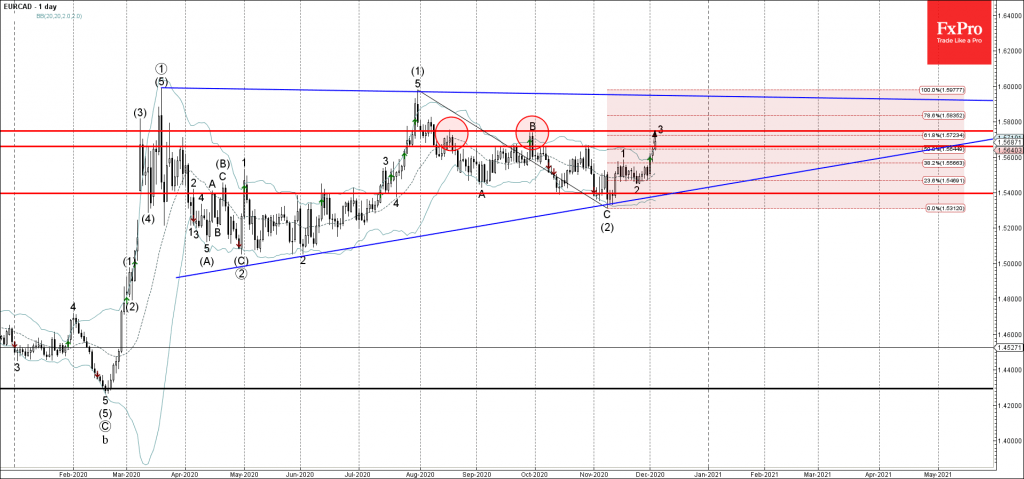
EURCAD recently broke above the key resistance level 1.5660 (which reversed the price twice in October as can be seen from the daily EURCAD chart below).

The breakout of the resistance level 1.5660 coincided with the breakout of the 50% Fibonacci correction of the previous medium-term ABC correction (2) from July.

EURCAD is expected to rise further toward the next resistance level 1.5745 (monthly high from August and the target price for the termination of the active impulse wave 3).

AddThis Website Tools
The FxPro Tech Analysis Team

The FxPro technical experts prepare a daily analysis of the most active currency pairs (majors, crosses, exotics) and commodities. Selected instruments are reviewed on daily trends (D1, H4), using the active Elliott Wave setups, Japanese candlesticks, indicators, and support/resistance levels.

Share
Published by
The FxPro Tech Analysis Team
Tags: EURCAD

Recent Posts

Video: Dollar and Indices are trying to find footing after the fall

The dollar experienced a sell-off but rallied back up by the end of the week.…

17 hours ago

What is next: BoJ, Fed, SNB & BoE Rates

The new week will be packed with economic data and decisions from key central banks.…

20 hours ago

Dollar attempts to rebound after oversold conditions

Despite economic factors working against the dollar, its oversold condition helped it this week or…

21 hours ago

USDCAD Wave Analysis – 14 March 2025

USDCAD: ⬇️ Sell - USDCAD reversed from key resistance level 1.4500 - Likely to fall…

22 hours ago

Solana Wave Analysis – 14 March 2025

Solana: ⬆️ Buy - Solana reversed from the long-term support level 113.75 - Likely to…

22 hours ago

Adobe Wave Analysis – 13 March 2025

Adobe: ⬇️ Sell - Adobe broke round support level 400.00 - Likely to fall to…

2 days ago