Categories: Technical analysis

EURCAD Wave Analysis – 29 June 2023


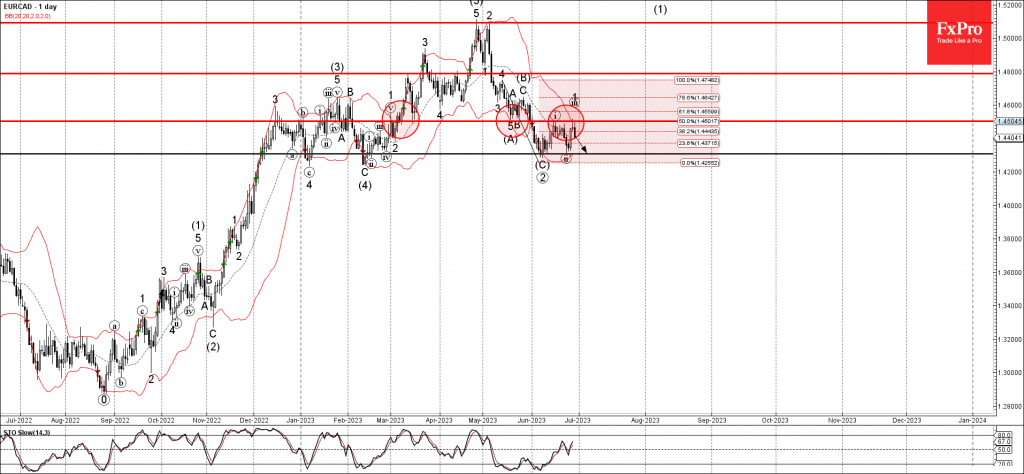
– EURCAD reversed from resistance level 1.4500

– Likely to fall to support level 1.4300

EURCAD currency pair recently reversed down from the key resistance level 1.4500 (top of the previous impulse wave (i)) intersecting with the upper daily Bollinger Band.

The downward reversal from the resistance level 1.4500 created the daily Japanese candlesticks reversal pattern Shooting Star Doji.

EURCAD currency pair can be expected to fall further toward the next support level 1.4300 (low of the previous waves (ii), (C)).

The FxPro Tech Analysis Team

The FxPro technical experts prepare a daily analysis of the most active currency pairs (majors, crosses, exotics) and commodities. Selected instruments are reviewed on daily trends (D1, H4), using the active Elliott Wave setups, Japanese candlesticks, indicators, and support/resistance levels.

Share
Published by
The FxPro Tech Analysis Team
Tags: EURCAD

Recent Posts

EURCAD Wave Analysis 6 September 2024

- EURCAD reversed from pivotal support level 1.4900 - Likely to rise to resistance level…

1 day ago

EURUSD Wave Analysis 6 September 2024

- EURUSD reversed from support level 1.1030 - Likely to rise to resistance level 1.1200…

1 day ago

Further Unwinding of Carry Trade

The unwinding of the carry trade in the FX market continues, with the major safe…

1 day ago

Bitcoin pressured by risk-off mood

Market Picture The pressure on risk assets continues, pushing the crypto market capitalisation back below…

2 days ago

AUDUSD Wave Analysis 5 September 2024

- AUDUSD reversed from support level 0.6700 - Likely to rise to resistance level 0.6800…

2 days ago

Gold Wave Analysis 5 September 2024

- Gold reversed from support level 2475.00 - Likely to rise to resistance level 2535.00…

2 days ago

This website uses cookies