Categories: Technical analysis

EURCAD Wave Analysis – 27 July, 2020

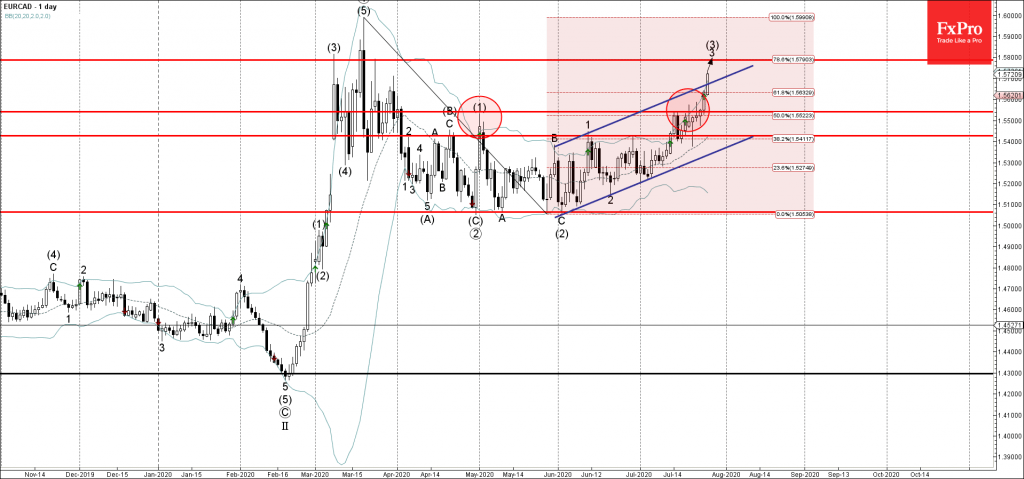
• EURCAD broke key resistance level 1.5540
• Likely to rise to 1.5785

EURCAD recently broke above the key resistance level 1.5540 (former monthly high from May), intersecting with the 50% Fibonacci retracement of the previous downward correction from March.

The breakout of the resistance level 1.5540 accelerated the active impulse waves 3 and (3).

EURCAD is likely to rise further toward the next resistance level 1.5785 (top of the Shooting Star from March and the target for the completion of wave 3).

AddThis Website Tools
The FxPro Tech Analysis Team

The FxPro technical experts prepare a daily analysis of the most active currency pairs (majors, crosses, exotics) and commodities. Selected instruments are reviewed on daily trends (D1, H4), using the active Elliott Wave setups, Japanese candlesticks, indicators, and support/resistance levels.

Share
Published by
The FxPro Tech Analysis Team
Tags: EURCAD

Recent Posts

Pfizer Wave Analysis – 27 March 2025

Pfizer: ⬇️ Sell - Pfizer broke support level 25.20 - Likely to fall to support level…

42 minutes ago

Silver Wave Analysis – 27 March 2025

Silver: ⬆️ Buy - Silver broke resistance area - Likely to rise to resistance level…

42 minutes ago

EURGBP Wave Analysis – 27 March 2025

EURGBP: ⬇️ Sell - EURGBP broke support area - Likely to fall to support level…

5 hours ago

3M Wave Analysis – 27 March 2025

3M: ⬇️ Sell - 3M reversed from resistance area - Likely to fall to support…

5 hours ago

Smashed Hopes for US Stocks Recovery

The US stock market faced resistance from new auto tariffs and concerns about global response,…

8 hours ago

Gold and Silver about to break the ceiling

Gold has experienced growth, reaching historical highs due to new tariff wars. Silver has also…

9 hours ago