Categories: Technical analysis

EURCAD Wave Analysis – 20 November, 2019

  • EURCAD reversed from resistance level 1,470
  • Likely to fall to 1,4550

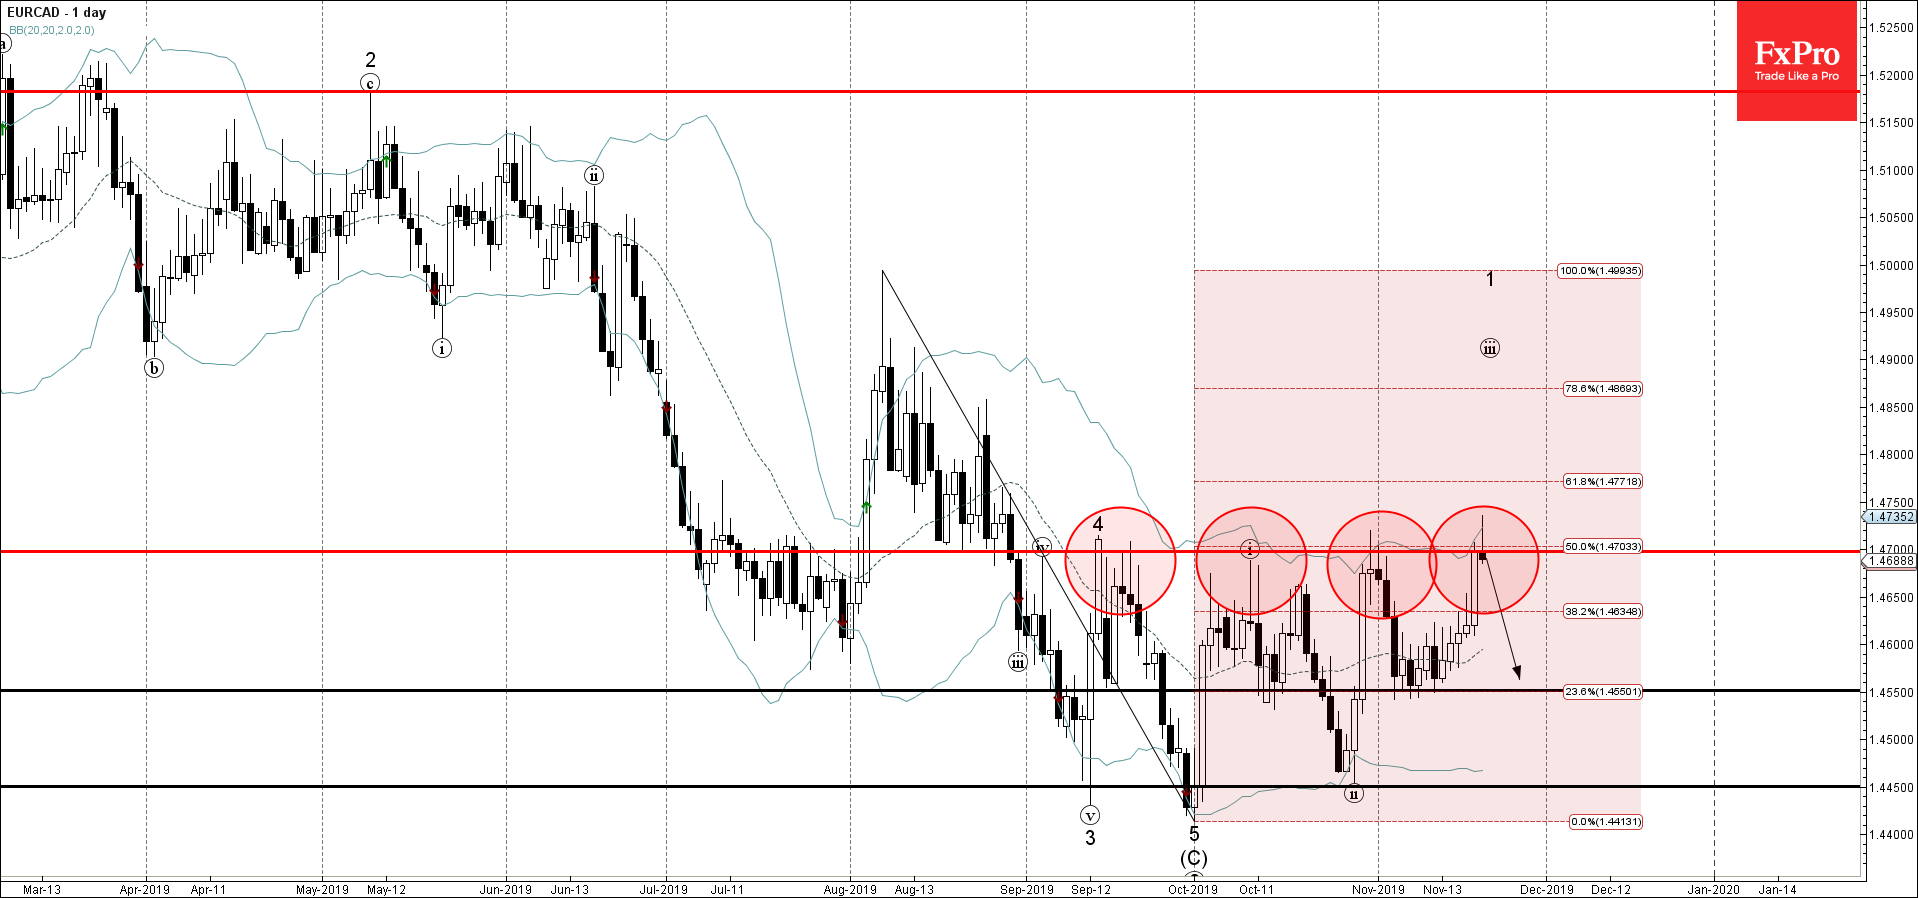
EURCAD today reversed down from the key resistance level 1,4700 (which has been reversing the price form the middle of September) – intersecting with the upper daily Bollinger Band.

The resistance level 1,4700 is further strengthen by the nearby 50% Fibonacci correction of the previous downward impulse from August.

EURCAD is expected to fall toward the next support level 1,4550  (which reversed the price multiple times at the start of November).

The FxPro Tech Analysis Team

The FxPro technical experts prepare a daily analysis of the most active currency pairs (majors, crosses, exotics) and commodities. Selected instruments are reviewed on daily trends (D1, H4), using the active Elliott Wave setups, Japanese candlesticks, indicators, and support/resistance levels.

Share
Published by
The FxPro Tech Analysis Team
Tags: EURCAD

Recent Posts

USDJPY Wave Analysis 6 May 2024

- USDJPY reversed from support zone - Likely to rise to resistance level 155.65 USDJPY…

14 hours ago

Gold Wave Analysis 6 May 2024

- Gold reversed from support zone - Likely to rise to resistance level 2400.00 Gold…

14 hours ago

Oil Bounces Locally, Global Support 5% below Spot Price

The number of operating oil rigs in the US fell by 7 to 499. This…

18 hours ago

Crypto Market Tries to Break Local Downtrend

Market picture  Crypto market capitalisation has been up 2% over the past seven days and…

1 day ago

Adobe Wave Analysis 3 May 2024

- Adobe reversed from support zone - Likely to rise to resistance level 500.00 Adobe…

4 days ago

EURGBP Wave Analysis 3 May 2024

- EURGBP reversed from support zone - Likely to rise to resistance level 0.8625 EURGBP…

4 days ago

This website uses cookies