Categories: Technical analysis

EURCAD Wave Analysis – 17 December, 2021

• EURCAD reversed from resistance level 1.4535

• Likely to fall to support level 1.4260


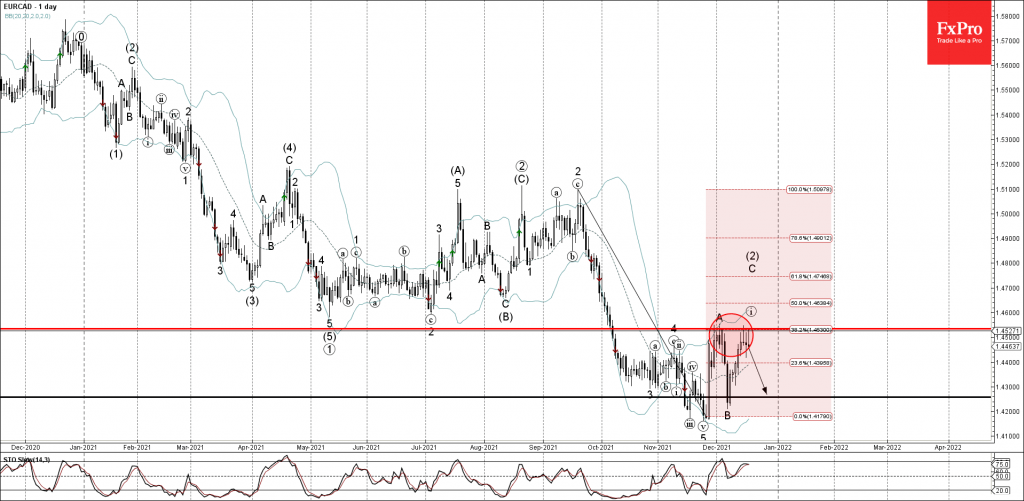
EURCAD currency pair recently reversed down strongly from the key resistance level 1.4535 (which has been reversing the price from the end of November, as can be seen below).

The resistance zone near the resistance level 1.4535 was further strengthened by the upper daily Bollinger band and by the 38.2% Fibonacci correction of the downward impulse from September.

Given the clear daily downtrend – EURCAD can be expected to fall further toward the next support level 1.4260 (which stopped the previous wave B).

The FxPro Tech Analysis Team

The FxPro technical experts prepare a daily analysis of the most active currency pairs (majors, crosses, exotics) and commodities. Selected instruments are reviewed on daily trends (D1, H4), using the active Elliott Wave setups, Japanese candlesticks, indicators, and support/resistance levels.

Share
Published by
The FxPro Tech Analysis Team
Tags: EURCAD

Recent Posts

Brent Crude oil Wave Analysis – 13 January 2026

Brent Crude oil ⬆️ Buy - Brent Crude oil rising inside impulse wave c -…

10 hours ago

USDJPY Wave Analysis – 13 January 2026

USDJPY ⬆️ Buy - USDJPY broke resistance area - Likely to rise to resistance level…

10 hours ago

Exxon Mobil Wave Analysis – 13 January 2026

Exxon Mobil ⬆️ Buy - Exxon Mobil broke resistance level 125.60 - Likely to rise…

10 hours ago

BNB Wave Analysis – 13 January 2026

Brent Crude oil ⬆️ Buy - BNB broke out of sideways price range - Likely…

10 hours ago

A slightly weaker CPI was not enough to break through the highs

US CPI data a bit softer than forecasts, sparking brief market optimism, but resistance remains.…

16 hours ago

Pro News Flash: Global Tensions Fuel a Fresh Oil Rally

🛢️ Oil prices are finding fresh strength as geopolitical tensions in the Middle East reignite…

16 hours ago

This website uses cookies