Categories: Technical analysis

EURCAD Wave Analysis 15 October, 2020

• EURCAD reversed from support level 1.5430

• Likely to rise to 1.5560

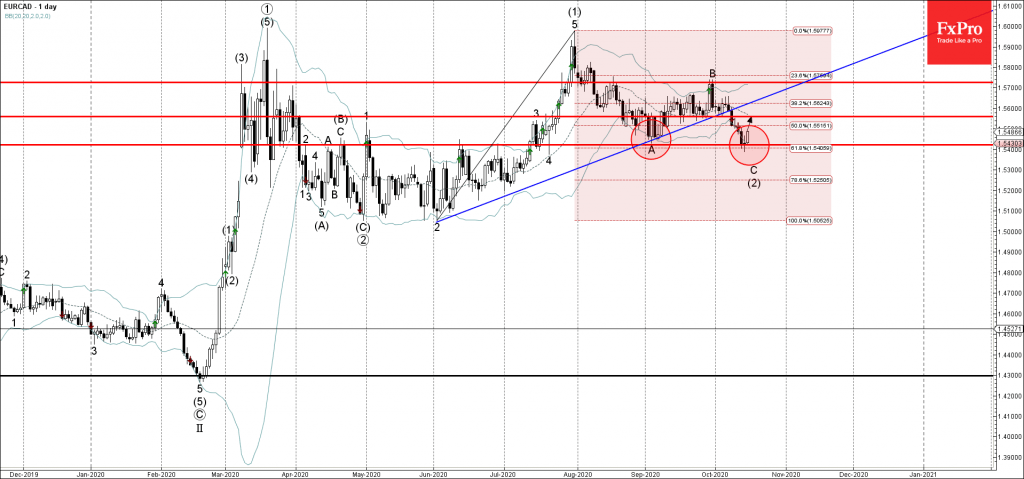
EURCAD today reversed up from the key support level 1.5430 (which stopped the previous correction A at the start of September, as can be seen below).

The support level 1.5430 was further strengthened by the lower daily Bollinger Band and the 61.8% Fibonacci correction of the upward impulse (1) from June.

EURCAD is likely to rise further toward the next resistance level 1.5560 (former multi-candle support from last month).

The FxPro Tech Analysis Team

The FxPro technical experts prepare a daily analysis of the most active currency pairs (majors, crosses, exotics) and commodities. Selected instruments are reviewed on daily trends (D1, H4), using the active Elliott Wave setups, Japanese candlesticks, indicators, and support/resistance levels.

Share
Published by
The FxPro Tech Analysis Team
Tags: EURCAD

Recent Posts

Pro News Flash: Bitcoin Is Stuck While Billion Dollar Buyers Step In

🛟 Bitcoin is having a hard time staying afloat, even as major players step in…

3 hours ago

Natural Gas. Current situation #trandingshorts #tradelikeapro #trading #tradingstrategy #naturalgas

We're gonna talk about the gas market, where prices are falling rapidly. Let's take a…

5 hours ago

The dollar remains focused on the labour market

The US dollar weakened significantly in 2025, and its fate depends on central banks. The…

5 hours ago

Major coins dragged the market down

Major cryptocurrencies fell amid declining market sentiment, low liquidity, and institutional rebalancing, with Bitcoin dropping…

7 hours ago

Dogecoin Wave Analysis – 15 December 2025

Dogecoin: ⬇️ Sell - Dogecoin broke long-term support level 0.1365 - Likely to fall to…

20 hours ago

Alcoa Wave Analysis – 15 December 2025

Alcoa: ⬇️ Sell - Alcoa reversed from strong resistance level 47.00 - Likely to fall to…

20 hours ago

This website uses cookies