Categories: Technical analysis

EURCAD Wave Analysis – 14 July, 2020

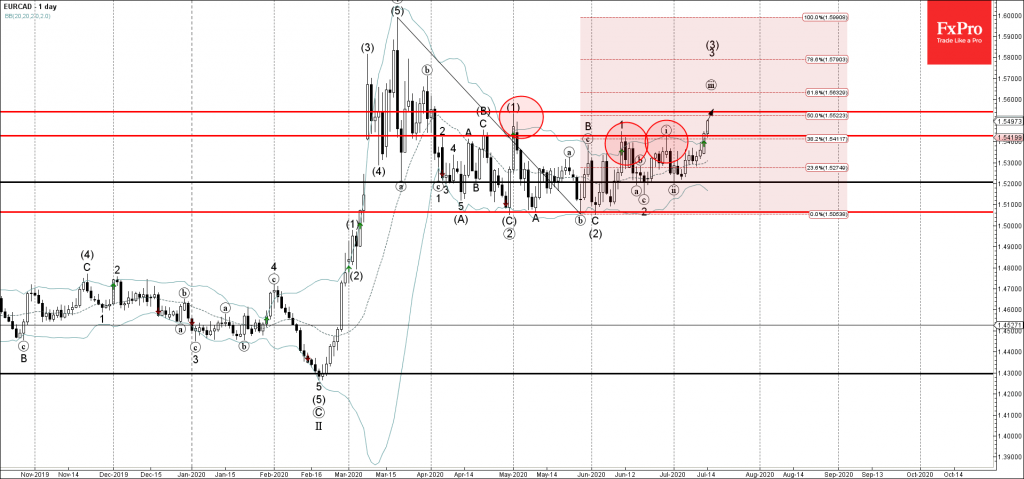
• EURCAD broke resistance area

• Likely to rise to 1.5540

EURCAD recently broke through the resistance area located between the key resistance level 1.5430 (top of the previous waves 1 and (i)) and the 38.2% Fibonacci correction of the earlier downward correction from March.

The breakout of this resistance area accelerated the active impulse waves (iii), 3 and (3).

EURCAD can be expected to rise further toward the next resistance level 1.5540 (top of the impulse wave (1) from the start of May).

The FxPro Tech Analysis Team

The FxPro technical experts prepare a daily analysis of the most active currency pairs (majors, crosses, exotics) and commodities. Selected instruments are reviewed on daily trends (D1, H4), using the active Elliott Wave setups, Japanese candlesticks, indicators, and support/resistance levels.

Share
Published by
The FxPro Tech Analysis Team
Tags: EURCAD

Recent Posts

The dollar does not tolerate dissent

US GDP growth is driven not by the White House, but by AI. The Bank…

9 hours ago

The crypto market has made a breakthrough

The crypto market surges, hitting new highs, with bullish sentiment for Bitcoin and Ethereum amid…

9 hours ago

Brent Crude oil Wave Analysis – 13 January 2026

Brent Crude oil ⬆️ Buy - Brent Crude oil rising inside impulse wave c -…

23 hours ago

USDJPY Wave Analysis – 13 January 2026

USDJPY ⬆️ Buy - USDJPY broke resistance area - Likely to rise to resistance level…

23 hours ago

Exxon Mobil Wave Analysis – 13 January 2026

Exxon Mobil ⬆️ Buy - Exxon Mobil broke resistance level 125.60 - Likely to rise…

23 hours ago

BNB Wave Analysis – 13 January 2026

Brent Crude oil ⬆️ Buy - BNB broke out of sideways price range - Likely…

23 hours ago

This website uses cookies