Categories: Technical analysis

EURCAD Wave Analysis 14 January, 2021

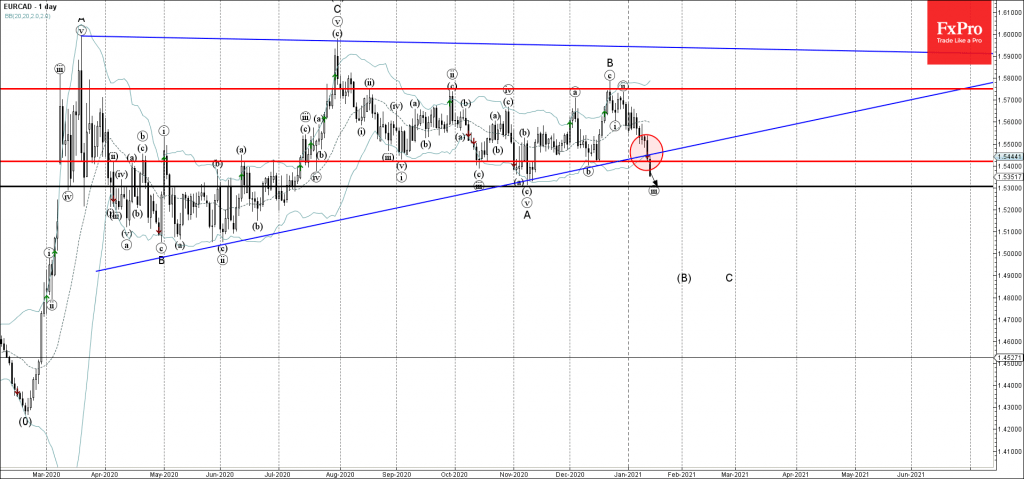
• EURCAD broke support area

• Likely to fall to 1.5300

EURCAD recently broke through the support area lying between the key support level 1.5420 (low of wave (b) from December) and the support trendline of the weekly Triangle from last year.

The breakout of this support area stopped should accelerate the active short-term impulse wave (iii).

EURCAD is expected to fall further toward the next support level 1,5300 (monthly low from November and the target for the completion of wave (iii)).

AddThis Website Tools
The FxPro Tech Analysis Team

The FxPro technical experts prepare a daily analysis of the most active currency pairs (majors, crosses, exotics) and commodities. Selected instruments are reviewed on daily trends (D1, H4), using the active Elliott Wave setups, Japanese candlesticks, indicators, and support/resistance levels.

Share
Published by
The FxPro Tech Analysis Team
Tags: EURCAD

Recent Posts

CADJPY Wave Analysis – 23 April 2025

CADJPY: ⬆️ Buy - CADJPY reversed from strong support area - Likely to rise to…

2 hours ago

USDJPY Wave Analysis – 23 April 2025

USDJPY: ⬆️ Buy - USDJPY reversed from the support area - Likely to rise to…

2 hours ago

Europe’s Growth Stalls Again as the Euro Enters Correction Mode

Eurozone business activity slows as falling orders and declining confidence impact growth. Manufacturing PMI remains…

7 hours ago

The Rapid Assault on Crypto

The cryptocurrency market experienced a significant surge, with market capitalisation reaching $2.95 trillion. Bitcoin is…

10 hours ago

Bitcoin Wave Analysis – 22 April 2025

Bitcoin: ⬆️ Buy - Bitcoin broke round resistance level 90000.00 - Likely to rise to…

1 day ago

AUDUSD Wave Analysis – 22 April 2025

AUDUSD: ⬇️ Sell - AUDUSD reversed from the key resistance level 0.6400 - Likely to…

1 day ago