Categories: Technical analysis

EURCAD Wave Analysis 1 July 2024

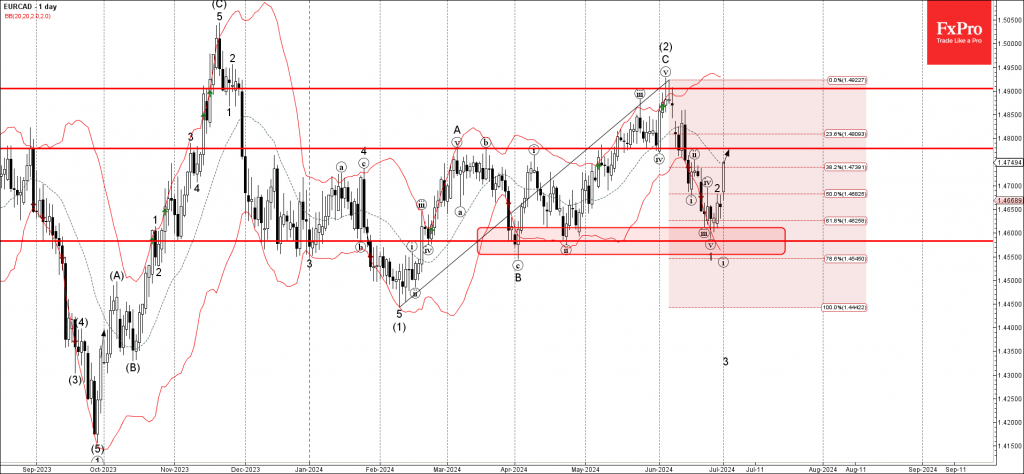
– EURCAD reversed from support zone

– Likely to rise to resistance level 1.4780

EURCAD recently reversed up with the daily Hammer from the support zone located between the key support level 1.4580 (which has been reversing the price from the start of April) and the lower daily Bollinger Band.

The upward reversal from this support zone started the active minor ABC correction 2.

Given the strength of the support level 1.4580, EURCAD currency pair can be expected to rise further toward the next resistance level 1.4780 (former pivotal support from May).

AddThis Website Tools
The FxPro Tech Analysis Team

The FxPro technical experts prepare a daily analysis of the most active currency pairs (majors, crosses, exotics) and commodities. Selected instruments are reviewed on daily trends (D1, H4), using the active Elliott Wave setups, Japanese candlesticks, indicators, and support/resistance levels.

Share
Published by
The FxPro Tech Analysis Team
Tags: EURCAD

Recent Posts

Gold Wave Analysis – 16 April 2025

Gold: ⬆️ Buy - Gold broke resistance zone - Likely to rise to the resistance…

4 hours ago

GBPUSD Wave Analysis – 16 April 2025

GBPUSD: ⬆️ Buy - GBPUSD broke key resistance level 1.3200 - Likely to rise to…

4 hours ago

Platinum Wave Analysis – 15 April 2025

Platinum: ⬆️ Buy - Platinum reversed from support level 905.00 - Likely to rise to…

13 hours ago

USDJPY Wave Analysis – 15 April 2025

USDJPY: ⬆️ Buy - USDJPY reversed from long-term support level 142.00 - Likely to rise…

13 hours ago

FTSE 100 Wave Analysis – 15 April 2025

FTSE 100: ⬆️ Buy - FTSE 100 index broke the resistance zone - Likely to rise…

15 hours ago

EURGBP Wave Analysis – 15 April 2025

EURGBP: ⬇️ Sell - EURGBP reversed from the resistance zone - Likely to fall to support…

15 hours ago