Categories: Technical analysis

EURAUD Wave Analysis 1 August 2024

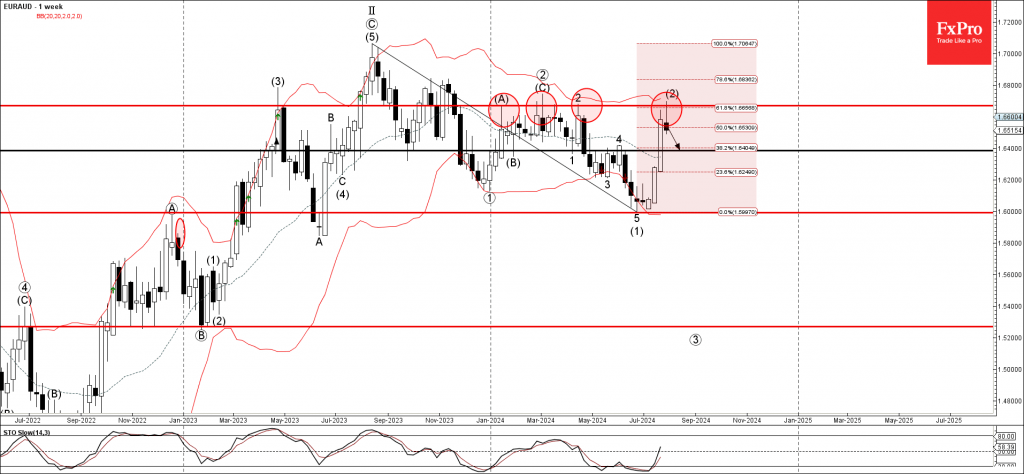
– EURAUD reversed from long-term resistance level 1.6670

– Likely to fall to support level 1.6400

EURAUD currency pair recently reversed down from the resistance area located between the major long-term resistance level 1.6670 (which has been reversing the pair from January), 61.8% Fibonacci correction of the downtrend from 2023 and the upper weekly Bollinger Band.

The downward reversal from this resistance zone is likely to form the weekly Shooting Star (strong sell signal) – if the pair closes this week near the current levels.

Given the strength of the resistance level 1.6670, EURAUD currency pair can be expected to fall further toward the next support level 1.6400.

The FxPro Tech Analysis Team

The FxPro technical experts prepare a daily analysis of the most active currency pairs (majors, crosses, exotics) and commodities. Selected instruments are reviewed on daily trends (D1, H4), using the active Elliott Wave setups, Japanese candlesticks, indicators, and support/resistance levels.

Share
Published by
The FxPro Tech Analysis Team
Tags: EURAUD

Recent Posts

CHFJPY Wave Analysis – 9 January 2026

CHFJPY: ⬆️ Buy - CHFJPY reversed from support area - Likely to rise to resistance…

2 days ago

Exxon Mobil Wave Analysis – 9 January 2026

Exxon Mobil: ⬆️ Buy - Exxon Mobil reversed from support area - Likely to rise…

2 days ago

Pro News Weekly: Dollar Rebounds as Markets Test New Limits

Welcome to Pro News Weekly! Here’s what is shaping the markets: 💵 The U.S. dollar…

2 days ago

Geopolitics will destroy the euro

•    EURUSD falls due to geopolitics and expectations of tariff removal •    Gold returns to…

3 days ago

Platinum Wave Analysis – 8 January 2026

Platinum: ⬇️ Sell - Platinum reversed from pivotal resistance level 150.00 - Likely to fall to…

3 days ago

Baidu Wave Analysis – 8 January 2026

Baidu: ⬇️ Sell - Baidu reversed from resistance zone - Likely to fall to support level…

3 days ago

This website uses cookies