financial stock market graph on technology abstract background
• EUR50 reversed from key resistance level 3820.00
• Likely to fall to support level 3700.00
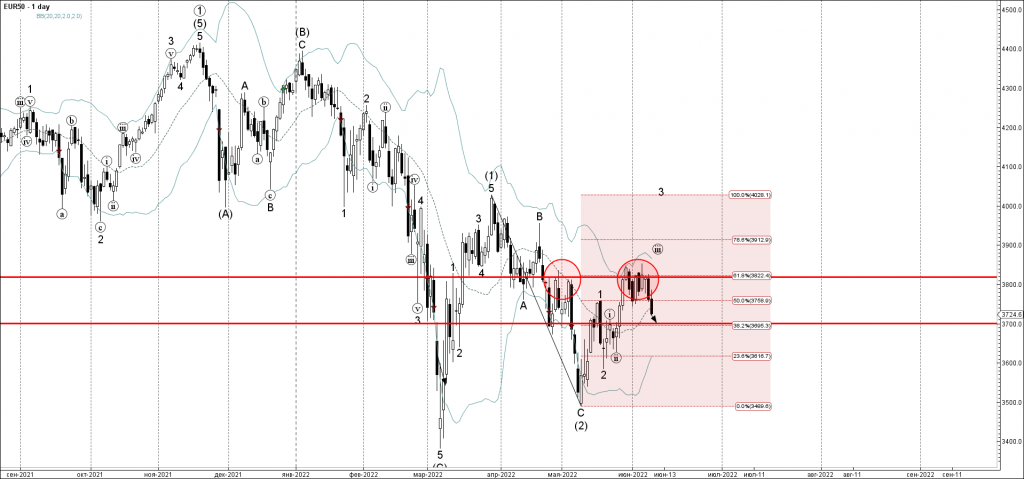
EUR50 index recently reversed down from the key resistance level 3820.00 (former support from the start of April, which has been reversing the price from the end of April).
The resistance zone near the resistance level 3820.00 was strengthened by the upper daily Bollinger Band and by the 61.8% Fibonacci correction of the earlier downward wave (2) from April.
Given the clear downtrend, EUR50 index can be expected to fall further toward the next support level 3700.00.
The crypto market is experiencing a decline in market capitalisation, dipping below previous highs due…
Tesla: ⬇️ Sell Tesla falling inside sharp impulse waves 5 and (C) Likely to fall…
Ebay: ⬇️ Sell - Ebay reversed from the resistance area - Likely to fall to…
S&P 500: ⬇️ Sell - S&P 500 index broke support zone - Likely to fall…
GBPCAD: ⬆️ Buy - GBPCAD rising inside minor impulse wave 3 - Likely to reach…
Gold may fly to the new heights but there are risks following the stock indices.
This website uses cookies