Categories: Technical analysis

EUR50 Wave Analysis – 2 March 2023

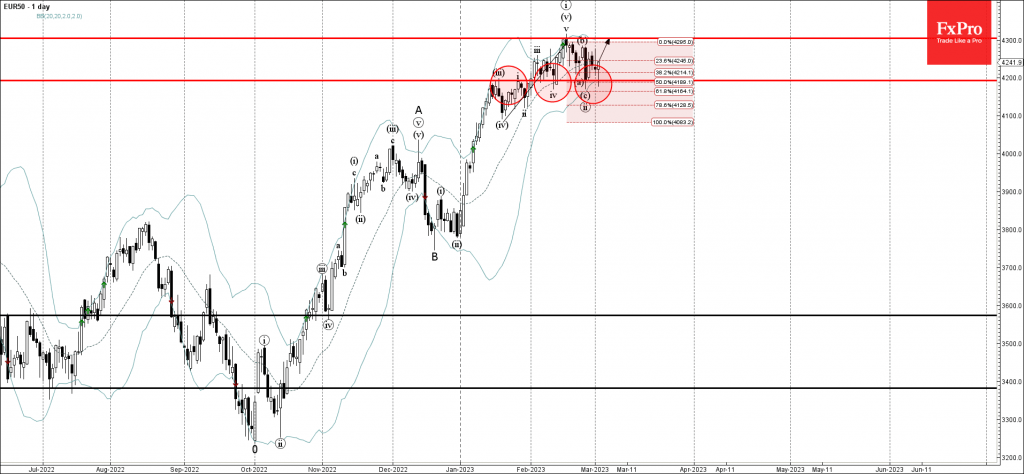
• EUR50 reversed from support level 4200.00

• Likely to rise to resistance levels 4300.00

EUR50 index previously reversed up from the support level 4200.00 (former resistance from January) intersecting with the lower daily Bollinger Band and the 50% Fibonacci correction of the upward impulse from January.

The upward reversal from the support level 4200.00 is likely to form the daily Hammer today – strong buy signal for this index.

Given the overriding uptrend, EUR50 index can be expected to rise further toward the next resistance level 4300.00 (top of the previous impulse wave (v)).

The FxPro Tech Analysis Team

The FxPro technical experts prepare a daily analysis of the most active currency pairs (majors, crosses, exotics) and commodities. Selected instruments are reviewed on daily trends (D1, H4), using the active Elliott Wave setups, Japanese candlesticks, indicators, and support/resistance levels.

Share
Published by
The FxPro Tech Analysis Team
Tags: EUR50

Recent Posts

The yen returned to the Takaichi trade

The dollar resumed its growth after the lawsuit against the Fed chairman. Rumours of early…

2 minutes ago

Nat Gas Current situation #tradelikeapro #trading #natgas #tradingstrategy #tradingshorts

Today is Tuesday, the 13th of January, and we will talk about the natural gas…

1 hour ago

Bitcoin Cash Wave Analysis – 12 January 2026

Bitcoin Cash: ⬇️ Sell - Bitcoin Cash reversed from resistance area - Likely to fall…

11 hours ago

EURJPY Wave Analysis – 12 January 2026

EURJPY: ⬆️ Buy - EURJPY reversed from support area - Likely to rise to resistance…

11 hours ago

Gold shines on an anti-fiat thesis

The dollar suffered due to threats to the Fed’s independence. Gold managed to renew its…

21 hours ago

SP500 Current situation #trading #tradelikeapro #sp500 #tradingshorts #tradingstrategy

Today is Monday, the 12th of January, and once again we will talk about the…

21 hours ago

This website uses cookies