Categories: Technical analysis

EUR50 index Wave Analysis – 28 June 2023

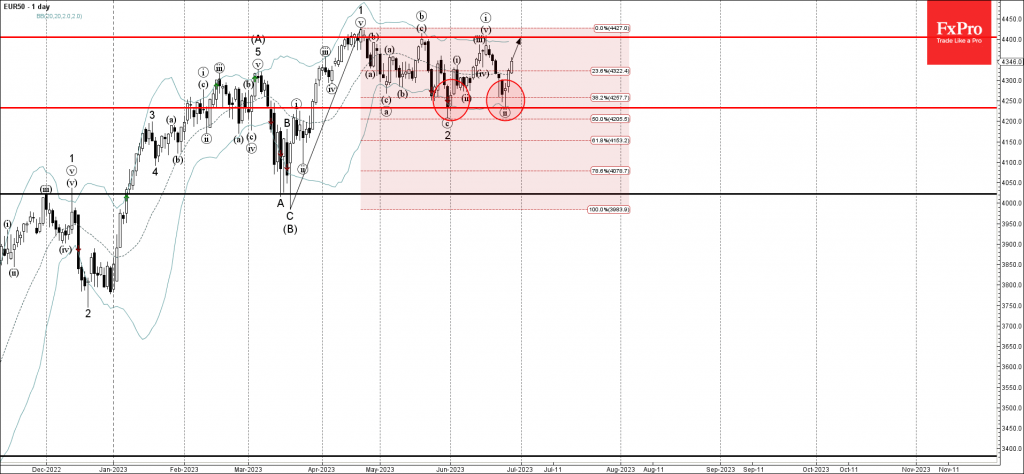
– EUR50 reversed from support level 4230.00

– Likely to rise to resistance level 4400.00

EUR50 index recently reversed up from the key support level 4230.00 (low of the previous correction 2) standing near the 38.2% Fibonacci correction of the upward impulse 1 from March.

The upward reversal from the support level 4330.00 created the daily Japanese candlesticks reversal pattern Hammer, which stopped the previous short-term corrective wave (ii).

Given the clear daily uptrend, EUR50 index can be expected to rise further toward the next resistance level 4400.00 (which stopped the previous waves 1, (b) and (i)).

The FxPro Tech Analysis Team

The FxPro technical experts prepare a daily analysis of the most active currency pairs (majors, crosses, exotics) and commodities. Selected instruments are reviewed on daily trends (D1, H4), using the active Elliott Wave setups, Japanese candlesticks, indicators, and support/resistance levels.

Share
Published by
The FxPro Tech Analysis Team
Tags: EUR50

Recent Posts

EURCAD Wave Analysis 6 September 2024

- EURCAD reversed from pivotal support level 1.4900 - Likely to rise to resistance level…

1 day ago

EURUSD Wave Analysis 6 September 2024

- EURUSD reversed from support level 1.1030 - Likely to rise to resistance level 1.1200…

1 day ago

Further Unwinding of Carry Trade

The unwinding of the carry trade in the FX market continues, with the major safe…

2 days ago

Bitcoin pressured by risk-off mood

Market Picture The pressure on risk assets continues, pushing the crypto market capitalisation back below…

2 days ago

AUDUSD Wave Analysis 5 September 2024

- AUDUSD reversed from support level 0.6700 - Likely to rise to resistance level 0.6800…

2 days ago

Gold Wave Analysis 5 September 2024

- Gold reversed from support level 2475.00 - Likely to rise to resistance level 2535.00…

2 days ago

This website uses cookies