Categories: Technical analysis

Ethereum Wave Analysis – 9 July 2025

Ethereum: ⬆️ Buy

– Ethereum broke the resistance area

– Likely to rise to resistance level 2885.00

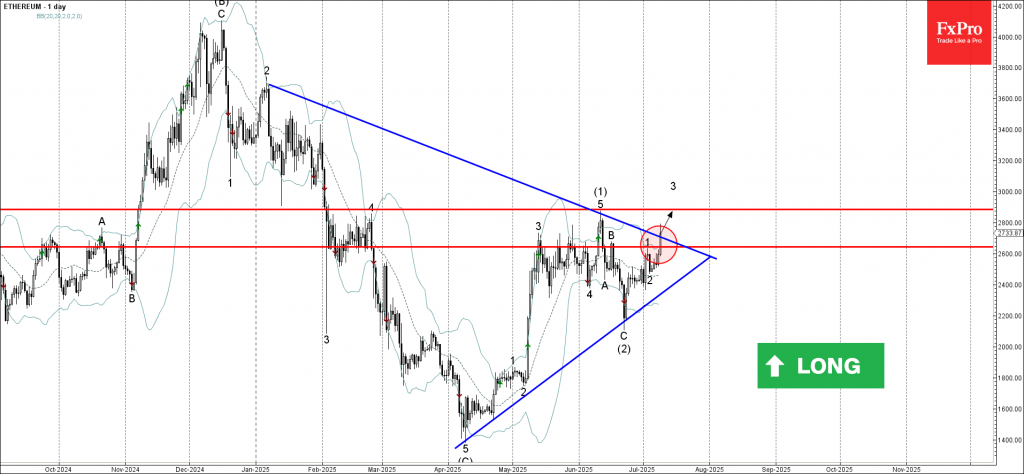
Ethereum cryptocurrency recently broke the resistance area located between the resistance level 2645.00 (which stopped wave 1 at the start of July) and the resistance trendline of the weekly Triangle from January.

The breakout of this resistance area accelerated the active short-term impulse wave 3 of the intermediate impulse wave (3) from June.

Given the strongly bullish sentiment seen across the crypto markets today, Ethereum cryptocurrency can be expected to rise to the next resistance level 2885.00 (top of wave (1) from June).

The FxPro Tech Analysis Team

The FxPro technical experts prepare a daily analysis of the most active currency pairs (majors, crosses, exotics) and commodities. Selected instruments are reviewed on daily trends (D1, H4), using the active Elliott Wave setups, Japanese candlesticks, indicators, and support/resistance levels.

Share
Published by
The FxPro Tech Analysis Team
Tags: Ethereum

Recent Posts

Geopolitics will destroy the euro

•    EURUSD falls due to geopolitics and expectations of tariff removal •    Gold returns to…

7 hours ago

Platinum Wave Analysis – 8 January 2026

Platinum: ⬇️ Sell - Platinum reversed from pivotal resistance level 150.00 - Likely to fall to…

20 hours ago

Baidu Wave Analysis – 8 January 2026

Baidu: ⬇️ Sell - Baidu reversed from resistance zone - Likely to fall to support level…

20 hours ago

EURUSD Wave Analysis – 8 January 2026

EURUSD: ⬇️ Sell - EURUSD broke daily up channel - Likely to fall to support…

22 hours ago

WTI crude oil Wave Analysis – 8 January 2026

WTI crude oil: ⬆️ Buy - WTI crude oil reversed from support zone - Likely…

22 hours ago

Do not underestimate dollar

Positive macro statistics for the US are helping the greenback. Gold could rise to $4,610…

1 day ago

This website uses cookies