Categories: Technical analysis

Ethereum Wave Analysis – 14 November 2025

Ethereum: ⬆️ Buy

– Ethereum reversed from support zone

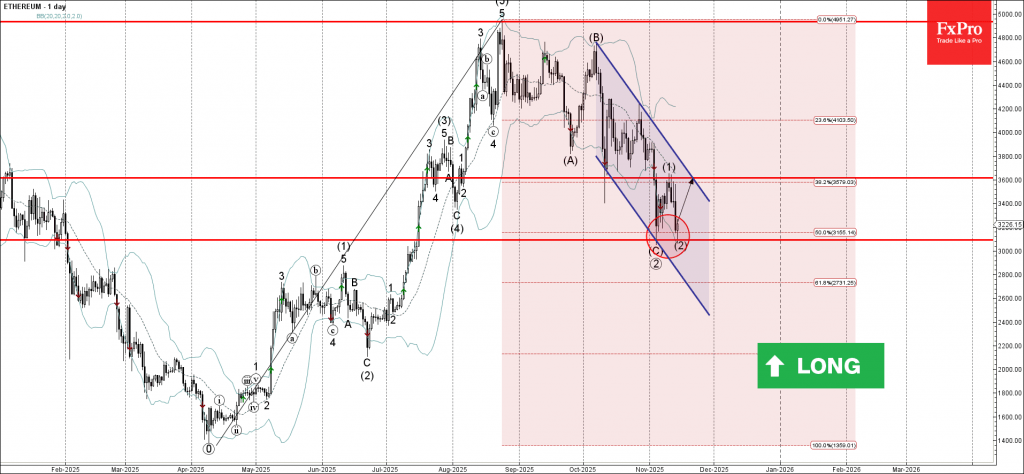
– Likely to rise to resistance level 3600.00

Ethereum cryptocurrency recently reversed from the support area between the support level 3090.00 (which stopped the previous impulse wave (C) at the start of November), 50% Fibonacci correction of the upward impulse from April and the lower daily Bollinger Band.

The upward reversal from this support zone stopped the previous medium-term ABC correction (2).

Given the strength of the support level 3090.00, Ethereum cryptocurrency can be expected to rise to the next resistance level 3600.00.

The FxPro Tech Analysis Team

The FxPro technical experts prepare a daily analysis of the most active currency pairs (majors, crosses, exotics) and commodities. Selected instruments are reviewed on daily trends (D1, H4), using the active Elliott Wave setups, Japanese candlesticks, indicators, and support/resistance levels.

Share
Published by
The FxPro Tech Analysis Team
Tags: Ethereum

Recent Posts

CADJPY Wave Analysis – 26 December 2025

CADJPY: ⬆️ Buy - CADJPY broke resistance level 114.30 - Likely to rise to resistance…

1 day ago

Toncoin Wave Analysis – 26 December 2025

Toncoin: ⬆️ Buy - Toncoin reversed from support zone - Likely to rise to resistance…

1 day ago

Nvidia Wave Analysis – 26 December 2025

Nvidia: ⬆️ Buy - Nvidia reversed from support zone - Likely to rise to resistance…

1 day ago

Palladium Wave Analysis – 26 December 2025

Palladium: ⬆️ Buy - Palladium reversed from support zone - Likely to rise to resistance…

1 day ago

AUDUSD Wave Analysis – 24 December 2025

AUDUSD: ⬆️ Buy - AUDUSD broke key resistance level 0.6690 - Likely to rise to…

3 days ago

Tron Wave Analysis – 24 December 2025

Tron: ⬇️ Sell - Tron reversed from resistance zone - Likely to fall to support…

3 days ago

This website uses cookies