Categories: Technical analysis

Ethereum Wave Analysis – 13 October 2025

Ethereum: ⬆️ Buy

– Ethereum reversed from the support zone

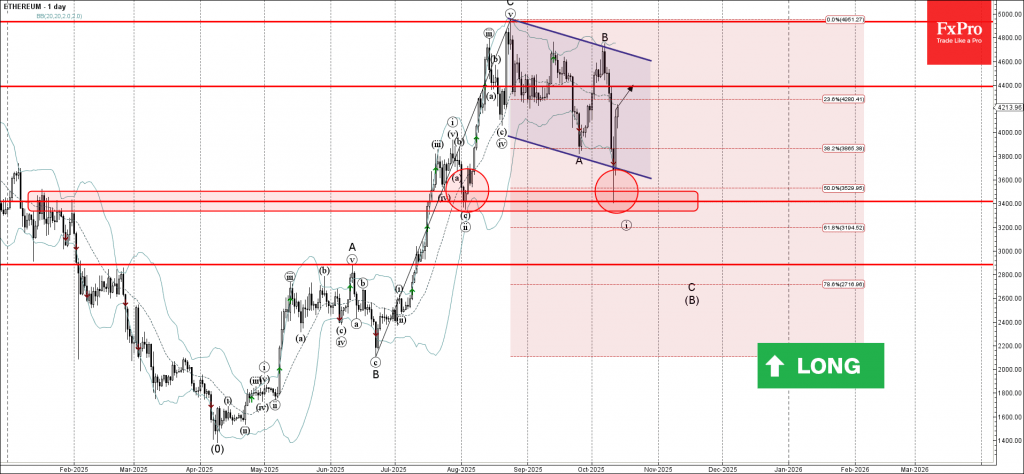
– Likely to rise to resistance level 4400.00.

Ethereum cryptocurrency recently reversed up from the support zone between the key support level 3400.00 (which also reversed the price in August), lower daily Bollinger Band and the 50% Fibonacci correction of the upward impulse from June.

The upward reversal from this support zone created the daily Japanese candlesticks reversal pattern Bullish Engulfing.

Given the clear daily uptrend, Ethereum cryptocurrency can be expected to rise to the next resistance level 4400.00.

The FxPro Tech Analysis Team

The FxPro technical experts prepare a daily analysis of the most active currency pairs (majors, crosses, exotics) and commodities. Selected instruments are reviewed on daily trends (D1, H4), using the active Elliott Wave setups, Japanese candlesticks, indicators, and support/resistance levels.

Share
Published by
The FxPro Tech Analysis Team
Tags: Ethereum

Recent Posts

Bear market rebound in crypto is likely to continue

Crypto rebounds continue; Bitcoin faces resistance, with a mixed market outlook ahead, as regulatory changes…

31 minutes ago

Coca-Cola Wave Analysis – 4 December 2025

Coca-Cola: ⬇️ Sell - Coca-Cola reversed from long-term resistance level 73.25 - Likely to fall to…

14 hours ago

DraftKings Wave Analysis – 4 December 2025

DraftKings: ⬆️ Buy - DraftKings reversed from support zone - Likely to rise to resistance level…

14 hours ago

NVDA Wave Analysis – 4 December 2025

NVDA: ⬆️ Buy - NVDA reversed from support zone - Likely to rise to resistance level…

15 hours ago

Basic Attention Token Wave Analysis – 4 December 2025

Basic Attention Token: ⬇️ Sell - Basic Attention Token reversed from resistance level 0.2800 - Likely…

15 hours ago

The euro is gaining momentum

The euro strengthens on improved business activity and stable policy, while the US dollar weakens…

23 hours ago

This website uses cookies