Categories: Technical analysis

Dow Jones Wave Analysis – 9 March, 2022

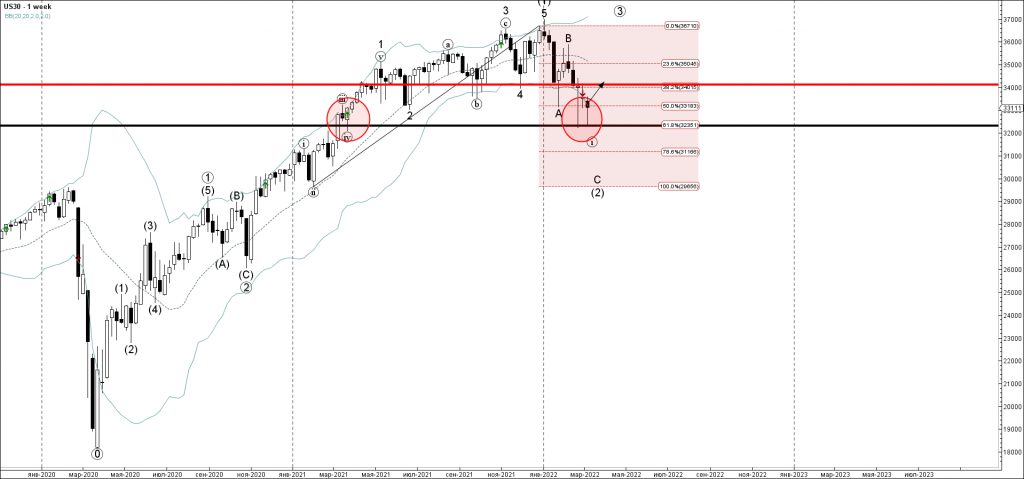
• Dow Jones reversed from support area
• Likely to rise to resistance level 34000.00

Dow Jones index recently reversed up from the support zone set between the strong support level 32325.00 (which has been reversing the price from the start of 2021), 61.8% Fibonacci correction of the upward impulse from lasy year and the lower weekly Bollinger Band.

The upward reversal from this support area will most likly create the weekly Hammer – similar to how it made it last month.

Give the multi-year uptrend – Dow Jones can be expected to rise further toward the next resistance level 34000.00 (former strong support from the middle of July).

The FxPro Tech Analysis Team

The FxPro technical experts prepare a daily analysis of the most active currency pairs (majors, crosses, exotics) and commodities. Selected instruments are reviewed on daily trends (D1, H4), using the active Elliott Wave setups, Japanese candlesticks, indicators, and support/resistance levels.

Share
Published by
The FxPro Tech Analysis Team
Tags: Dow Jones

Recent Posts

AUDJPY Wave Analysis – 5 December 2025

AUDJPY: ⬆️ Buy - AUDJPY broke long-term resistance level 102.30 - Likely to rise to…

3 hours ago

Aptos Wave Analysis – 5 December 2025

Aptos: ⬇️ Sell - Aptos testing major support at 1.688 - Likely to fall to…

3 hours ago

Pro News Weekly: Market Shake-Up, Dollar Drops, Gold Surges, Bitcoin Wobbles!

Welcome to Pro News Flash! 💵 The U.S. dollar slips 🏆 Major stock indices struggle…

9 hours ago

Solana Wave Analysis – 5 December 2025

Solana: ⬇️ Sell - Solana reversed from resistance zone - Likely to fall to support…

10 hours ago

EURAUD Wave Analysis – 5 December 2025

EURAUD : ⬇️ Sell - EURAUD broke the support level 1.7600 - Likely to fall…

10 hours ago

Forex has set its priorities

In 2026, experts favour the yen, see modest euro growth, and expect pressure on the…

14 hours ago

This website uses cookies