Categories: Technical analysis

Dow Jones Wave Analysis 9 December 2024

– Dow Jones reversed from resistance area

– Likely to fall to support level 44300.00

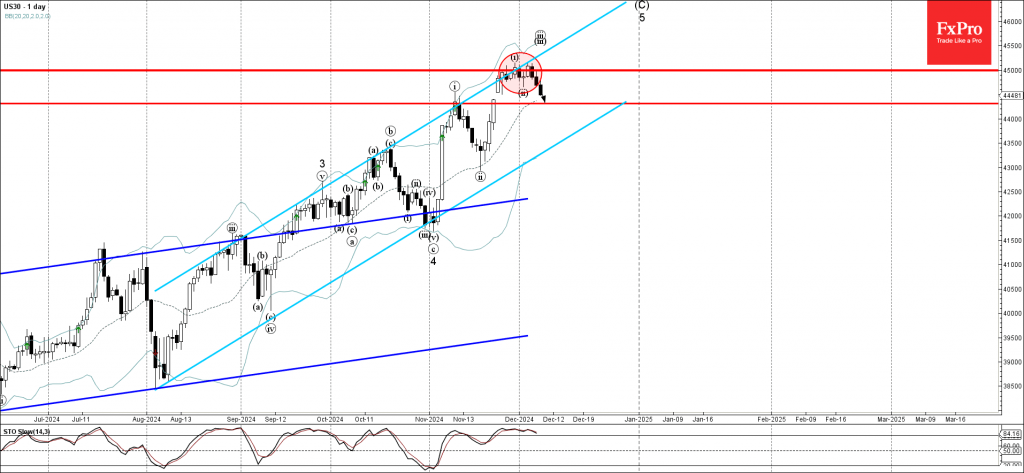
Dow Jones index previously reversed down from the resistance area between the resistance level 45000.00 (which has been reversing the index from the end of November), resistance trendline of the daily up channel from August and the upper daily Bollinger Band.

The downward reversal from this resistance zone started the active minor correction iv of the higher impulse wave 5 from last month.

Given the overbought daily Stochastic, Dow Jones index can be expected to fall toward the next support level 44300.00 (former resistance which stopped wave i at the start of November).

The FxPro Tech Analysis Team

The FxPro technical experts prepare a daily analysis of the most active currency pairs (majors, crosses, exotics) and commodities. Selected instruments are reviewed on daily trends (D1, H4), using the active Elliott Wave setups, Japanese candlesticks, indicators, and support/resistance levels.

Share
Published by
The FxPro Tech Analysis Team
Tags: Dow Jones

Recent Posts

Video: Dollar and Indices are trying to find footing after the fall

The dollar experienced a sell-off but rallied back up by the end of the week.…

2 days ago

What is next: BoJ, Fed, SNB & BoE Rates

The new week will be packed with economic data and decisions from key central banks.…

2 days ago

Dollar attempts to rebound after oversold conditions

Despite economic factors working against the dollar, its oversold condition helped it this week or…

2 days ago

USDCAD Wave Analysis – 14 March 2025

USDCAD: ⬇️ Sell - USDCAD reversed from key resistance level 1.4500 - Likely to fall…

2 days ago

Solana Wave Analysis – 14 March 2025

Solana: ⬆️ Buy - Solana reversed from the long-term support level 113.75 - Likely to…

2 days ago

Adobe Wave Analysis – 13 March 2025

Adobe: ⬇️ Sell - Adobe broke round support level 400.00 - Likely to fall to…

3 days ago

This website uses cookies