Categories: Technical analysis

Dow Jones Wave Analysis 6 October 2023

– Dow Jones reversed from support level 32875.00

– Likely to rise to resistance level 33875.00

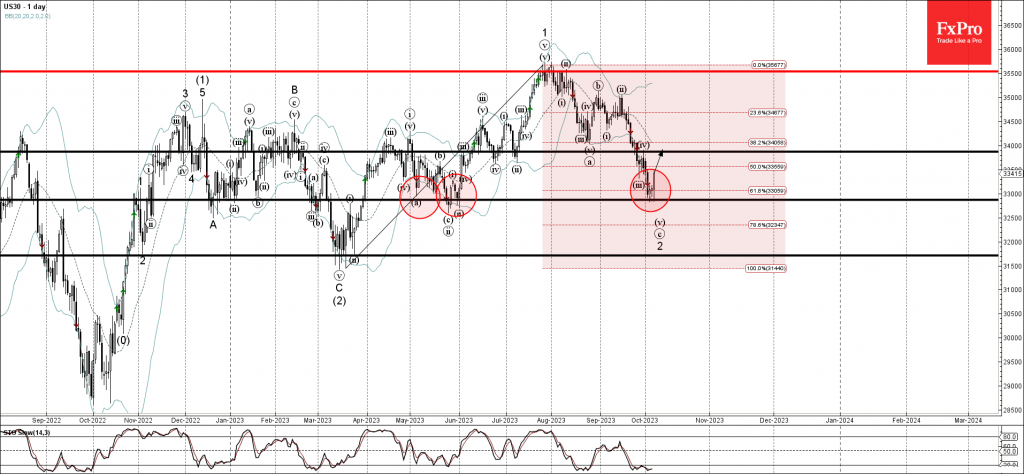
Dow Jones index recently reversed up from the pivotal support level 32875.00 (which has been reversing the price from May), coinciding with the lower daily Bollinger Band and the 61.8% Fibonacci correction of the upward impulse from March.

The upward reversal from the support level 32875.00 stopped the c-wave of the active ABC correction 2 from the end of July.

Given the still oversold daily Stochastic, Dow Jones index can be expected to rise further toward the next resistance level 33875.00 (top of the earlier wave iv).

The FxPro Tech Analysis Team

The FxPro technical experts prepare a daily analysis of the most active currency pairs (majors, crosses, exotics) and commodities. Selected instruments are reviewed on daily trends (D1, H4), using the active Elliott Wave setups, Japanese candlesticks, indicators, and support/resistance levels.

Share
Published by
The FxPro Tech Analysis Team
Tags: Dow Jones

Recent Posts

Gold shines on an anti-fiat thesis

The dollar suffered due to threats to the Fed’s independence. Gold managed to renew its…

4 hours ago

SP500 Current situation #trading #tradelikeapro #sp500 #tradingshorts #tradingstrategy

Today is Monday, the 12th of January, and once again we will talk about the…

4 hours ago

Crypto: sell-the-growth continues

Crypto markets remain volatile; Bitcoin faces selling pressure, XRP slips, Monero surges, and market signals…

5 hours ago

CHFJPY Wave Analysis – 9 January 2026

CHFJPY: ⬆️ Buy - CHFJPY reversed from support area - Likely to rise to resistance…

3 days ago

Exxon Mobil Wave Analysis – 9 January 2026

Exxon Mobil: ⬆️ Buy - Exxon Mobil reversed from support area - Likely to rise…

3 days ago

Pro News Weekly: Dollar Rebounds as Markets Test New Limits

Welcome to Pro News Weekly! Here’s what is shaping the markets: 💵 The U.S. dollar…

3 days ago

This website uses cookies