Categories: Technical analysis

Dow Jones Wave Analysis – 28 November, 2022

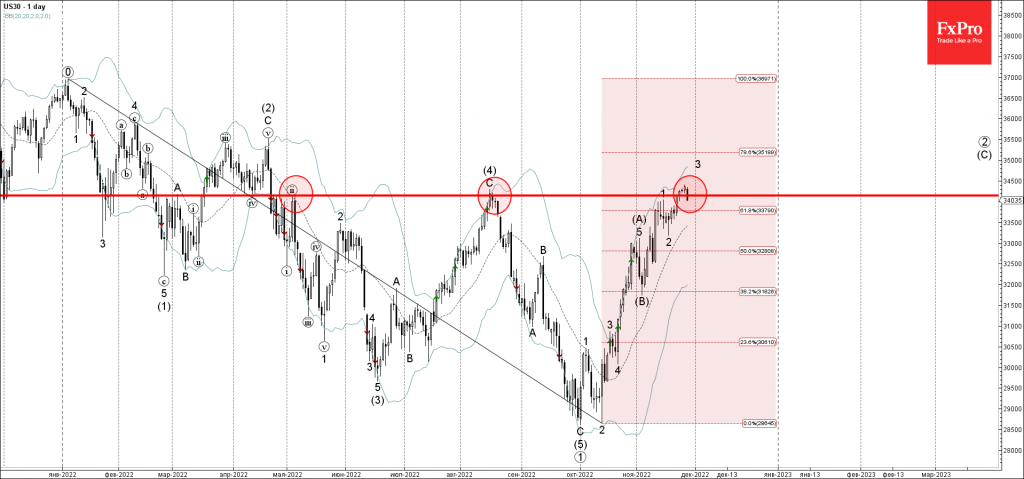
• Dow Jones reversed from resistance level 34145.00

• Likely to fall to support level 33500.00

Dow Jones index just reversed down from the long-term resistance level 34145.00 (previous monthly high from May and August), strengthened by the nearby upper daily Bollinger Band.

The downward reversal from the resistance level 34145.stopped the previous short-term impulse wave 3, which belongs to the intermediate impulse wave (C) from the start of November.

Given the strength of the resistance level 34145.00, Dow Jones index can be expected to fall further toward the next support level 33500.00.

The FxPro Tech Analysis Team

The FxPro technical experts prepare a daily analysis of the most active currency pairs (majors, crosses, exotics) and commodities. Selected instruments are reviewed on daily trends (D1, H4), using the active Elliott Wave setups, Japanese candlesticks, indicators, and support/resistance levels.

Share
Published by
The FxPro Tech Analysis Team
Tags: Dow Jones

Recent Posts

S&P 500 Wave Analysis 7 May 2024

- S&P 500 reversed from support level 5000.00 - Likely to rise to resistance level…

3 hours ago

USDCHF Wave Analysis 7 May 2024

- USDCHF reversed from support zone - Likely to rise to resistance level 0.9200 USDCHF…

3 hours ago

EURUSD at the equilibrium, where will it go next?

The single currency is trading near $1.076, waiting for further cues and facing serious resistance…

8 hours ago

Bitcoin can’t accelerate but won’t give up trying

Market picture  The crypto market capitalisation fell by 1.7% in 24 hours to $2.29 trillion,…

13 hours ago

USDJPY Wave Analysis 6 May 2024

- USDJPY reversed from support zone - Likely to rise to resistance level 155.65 USDJPY…

1 day ago

Gold Wave Analysis 6 May 2024

- Gold reversed from support zone - Likely to rise to resistance level 2400.00 Gold…

1 day ago

This website uses cookies