Categories: Technical analysis

Dow Jones Wave Analysis – 22 February, 2022

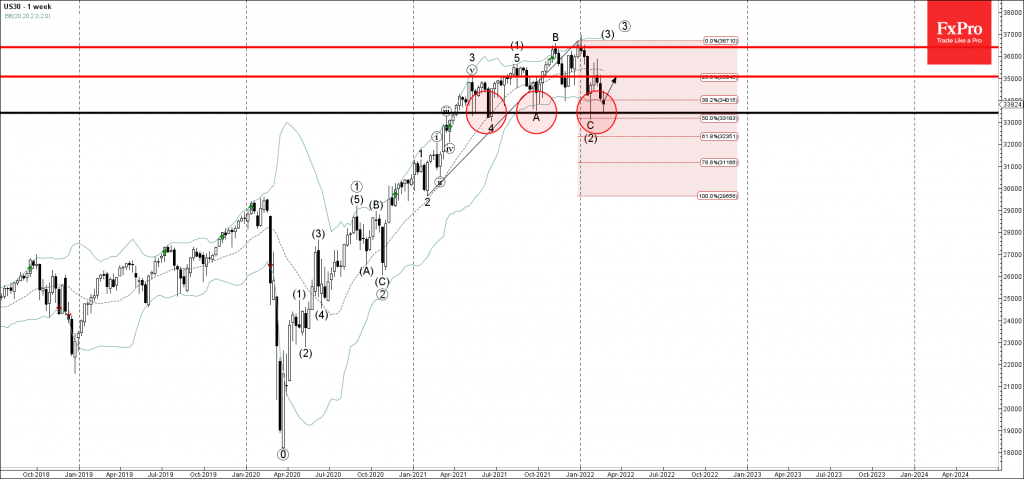
• Dow Jones reversed from support area

• Likely to rise to resistance level 35000.00

Dow Jones index today reversed up from the support area located between the multi-month support level 33425.00 (which has been reversing the index from the start of 2021), lower weekly Bollinger Band and the 50% Fibonacci correction of the previous upward impulse wave from last year.

The upward reversal from this support area continues the active medium-term impulse wave (3).

Given the clear daily uptrend – Dow Jones can be expected to rise further toward the next resistance level 35000.00.

The FxPro Tech Analysis Team

The FxPro technical experts prepare a daily analysis of the most active currency pairs (majors, crosses, exotics) and commodities. Selected instruments are reviewed on daily trends (D1, H4), using the active Elliott Wave setups, Japanese candlesticks, indicators, and support/resistance levels.

Share
Published by
The FxPro Tech Analysis Team
Tags: Dow Jones

Recent Posts

Crypto Market Tries to Break Local Downtrend 

Market picture  Crypto market capitalisation has been up 2% over the past seven days and…

3 hours ago

Adobe Wave Analysis 3 May 2024

- Adobe reversed from support zone - Likely to rise to resistance level 500.00 Adobe…

3 days ago

EURGBP Wave Analysis 3 May 2024

- EURJPY reversed from support zone - Likely to rise to resistance level 0.8625 EURGBP…

3 days ago

How Low Can the USDJPY Go?

USDJPY was slipping below 153 on Friday morning, a three-week low and having lost over…

3 days ago

Bitcoin’s Downtrend, Solana and Ethereum Form Double Bottom

Market picture  Crypto market capitalisation rose 3.3% in 24 hours to $2.22 trillion. Local capitalisation…

3 days ago

EURJPY Wave Analysis 2 May 2024

- EURJPY under strong bearish pressure - Likely to fall to support level 163.10 EURJPY…

4 days ago

This website uses cookies