Categories: Technical analysis

Dow Jones Wave Analysis – 2 February, 2022

• Dow Jones reversed from support zone

• Likely to rise to resistance level 36400

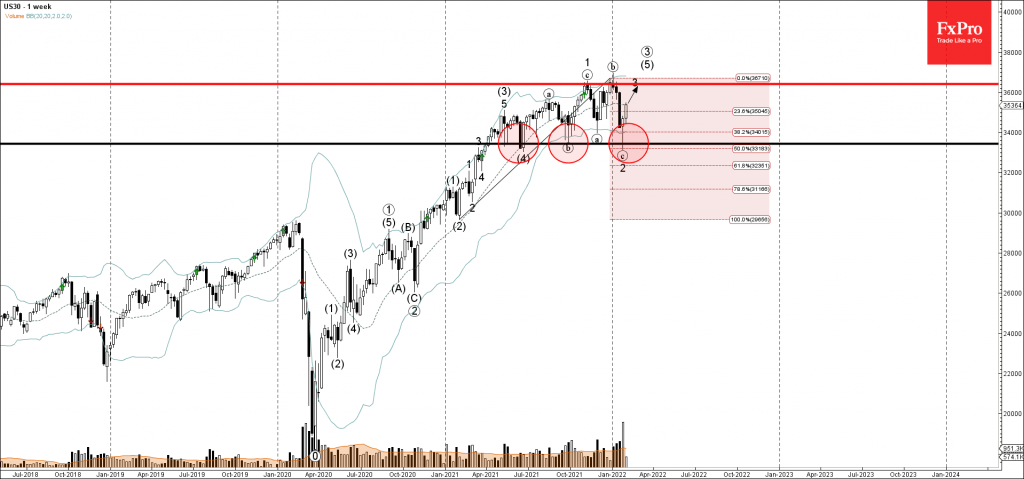
Dow Jones index recently reversed up with the weekly Hammer from the support zone lying between the key support level 33425.00 (which has been reversing the index from the start of 2021) and the lower weekly Bollinger Band.

This support zone was further strengthened by the 50% Fibonacci correction of the previous sharp upward impulse from the start of last year.

Given the clear multi-year uptrend – Dow Jones index can be expected to rise further toward the next resistance level 36400 (which stopped the earlier waves 1 and (b)).

The FxPro Tech Analysis Team

The FxPro technical experts prepare a daily analysis of the most active currency pairs (majors, crosses, exotics) and commodities. Selected instruments are reviewed on daily trends (D1, H4), using the active Elliott Wave setups, Japanese candlesticks, indicators, and support/resistance levels.

Share
Published by
The FxPro Tech Analysis Team
Tags: Dow Jones

Recent Posts

CHFJPY Wave Analysis – 9 January 2026

CHFJPY: ⬆️ Buy - CHFJPY reversed from support area - Likely to rise to resistance…

2 days ago

Exxon Mobil Wave Analysis – 9 January 2026

Exxon Mobil: ⬆️ Buy - Exxon Mobil reversed from support area - Likely to rise…

2 days ago

Pro News Weekly: Dollar Rebounds as Markets Test New Limits

Welcome to Pro News Weekly! Here’s what is shaping the markets: 💵 The U.S. dollar…

2 days ago

Geopolitics will destroy the euro

•    EURUSD falls due to geopolitics and expectations of tariff removal •    Gold returns to…

2 days ago

Platinum Wave Analysis – 8 January 2026

Platinum: ⬇️ Sell - Platinum reversed from pivotal resistance level 150.00 - Likely to fall to…

3 days ago

Baidu Wave Analysis – 8 January 2026

Baidu: ⬇️ Sell - Baidu reversed from resistance zone - Likely to fall to support level…

3 days ago

This website uses cookies